Holiday Inn 2008 Annual Report Download - page 64
Download and view the complete annual report
Please find page 64 of the 2008 Holiday Inn annual report below. You can navigate through the pages in the report by either clicking on the pages listed below, or by using the keyword search tool below to find specific information within the annual report.-
 1
1 -
2
-
3
-
4
-
5
-
6
-
7
-
8
-
9
-
10
-
11
-
12
-
13
-
14
-
15
-
16
-
17
-
18
-
19
-
20
-
21
-
22
-
23
-
24
-
25
-
26
-
27
-
28
-
29
-
30
-
31
-
32
-
33
-
34
-
35
-
36
-
37
-
38
-
39
-
40
-
41
-
42
-
43
-
44
-
45
-
46
-
47
-
48
-
49
-
50
-
51
-
52
-
53
-
 54
54 -
 55
55 -
 56
56 -
 57
57 -
 58
58 -
 59
59 -
 60
60 -
 61
61 -
 62
62 -
 63
63 -
 64
64 -
 65
65 -
 66
66 -
 67
67 -
 68
68 -
 69
69 -
 70
70 -
 71
71 -
 72
72 -
 73
73 -
 74
74 -
75
-
76
-
77
-
78
-
79
-
80
-
81
-
82
-
83
-
84
-
85
-
86
-
87
-
88
-
89
-
90
-
91
-
92
-
93
-
94
-
95
-
96
-
97
-
98
-
99
-
100
-
101
-
102
-
103
-
104
-
105
-
106
-
107
-
108
 |
 |

62 IHG Annual Report and Financial Statements 2008
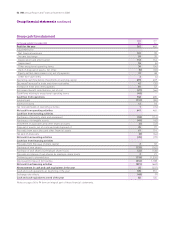
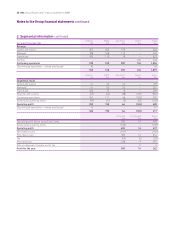
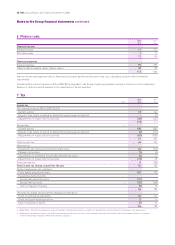
2 Segmental information continued
Americas EMEA Asia Pacific Central Group
Year ended 31 December 2008 $m $m $m $m $m
Revenue
Owned and leased 257 240 159 – 656
Managed 168 168 113 – 449
Franchised 495 110 18 – 623
Central – – – 126 126
Continuing operations 920 518 290 126 1,854
Discontinued operations – owned and leased 43–––43
963 518 290 126 1,897
Americas EMEA Asia Pacific Central Group
$m $m $m $m $m
Segmental result
Owned and leased 41 45 43 – 129
Managed 51 95 55 – 201
Franchised 426 75 8 – 509
Regional and central (67) (44) (38) (155) (304)
Continuing operations 451 171 68 (155) 535
Exceptional operating items (99) (21) (2) (10) (132)
Operating profit 352 150 66 (165) 403
Discontinued operations – owned and leased 14–––14
366 150 66 (165) 417
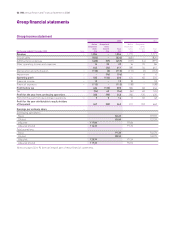
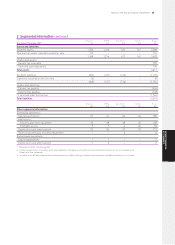
Continuing Discontinued Group
$m $m $m
Operating profit before exceptional items 535 14 549
Exceptional operating items (132) – (132)
Operating profit 403 14 417
Net finance costs (101) – (101)
Profit before tax 302 14 316
Tax (54) (5) (59)
Profit after tax 248 9 257
Gain on disposal of assets, net of tax – 5 5
Profit for the year 248 14 262
Notes to the Group financial statements continued