Holiday Inn 2008 Annual Report Download - page 66
Download and view the complete annual report
Please find page 66 of the 2008 Holiday Inn annual report below. You can navigate through the pages in the report by either clicking on the pages listed below, or by using the keyword search tool below to find specific information within the annual report.-
 1
1 -
2
-
3
-
4
-
5
-
6
-
7
-
8
-
9
-
10
-
11
-
12
-
13
-
14
-
15
-
16
-
17
-
18
-
19
-
20
-
21
-
22
-
23
-
24
-
25
-
26
-
27
-
28
-
29
-
30
-
31
-
32
-
33
-
34
-
35
-
36
-
37
-
38
-
39
-
40
-
41
-
42
-
43
-
44
-
45
-
46
-
47
-
48
-
49
-
50
-
51
-
52
-
53
-
54
-
55
-
 56
56 -
 57
57 -
 58
58 -
 59
59 -
 60
60 -
 61
61 -
 62
62 -
 63
63 -
 64
64 -
 65
65 -
 66
66 -
 67
67 -
 68
68 -
 69
69 -
 70
70 -
 71
71 -
 72
72 -
 73
73 -
 74
74 -
 75
75 -
 76
76 -
77
-
78
-
79
-
80
-
81
-
82
-
83
-
84
-
85
-
86
-
87
-
88
-
89
-
90
-
91
-
92
-
93
-
94
-
95
-
96
-
97
-
98
-
99
-
100
-
101
-
102
-
103
-
104
-
105
-
106
-
107
-
108
 |
 |

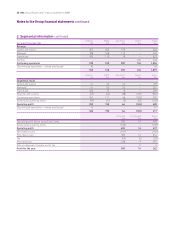
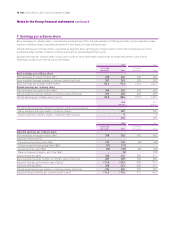
64 IHG Annual Report and Financial Statements 2008
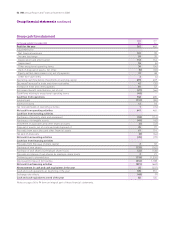
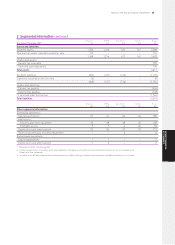
2 Segmental information continued
Americas EMEA Asia Pacific Central Group
Year ended 31 December 2007 $m $m $m $m $m
Revenue
Owned and leased 257 244 145 – 646
Managed 156 167 99 – 422
Franchised 489 81 16 – 586
Central – – – 117 117
Continuing operations 902 492 260 117 1,771
Discontinued operations – owned and leased 62 17 – – 79
964 509 260 117 1,850
Americas EMEA Asia Pacific Central Group
$m $m $m $m $m
Segmental result
Owned and leased 40 33 36 – 109
Managed 41 87 46 – 174
Franchised 425 58 6 – 489
Regional and central (66) (44) (25) (163) (298)
Continuing operations 440 134 63 (163) 474
Exceptional operating items 17 21 17 5 60
Operating profit 457 155 80 (158) 534
Discontinued operations – owned and leased 161––17
473 156 80 (158) 551
Continuing Discontinued Group
$m $m $m
Operating profit before exceptional items 474 17 491
Exceptional operating items 60 – 60
Operating profit 534 17 551
Net finance costs (90) – (90)
Profit before tax 444 17 461
Tax (24) (6) (30)
Profit after tax 420 11 431
Gain on disposal of assets, net of tax – 32 32
Profit for the year 420 43 463
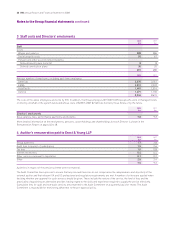
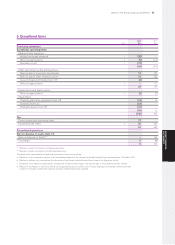
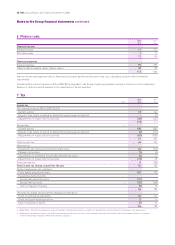
Notes to the Group financial statements continued