Holiday Inn 2008 Annual Report Download - page 63
Download and view the complete annual report
Please find page 63 of the 2008 Holiday Inn annual report below. You can navigate through the pages in the report by either clicking on the pages listed below, or by using the keyword search tool below to find specific information within the annual report.-
 1
1 -
2
-
3
-
4
-
5
-
6
-
7
-
8
-
9
-
10
-
11
-
12
-
13
-
14
-
15
-
16
-
17
-
18
-
19
-
20
-
21
-
22
-
23
-
24
-
25
-
26
-
27
-
28
-
29
-
30
-
31
-
32
-
33
-
34
-
35
-
36
-
37
-
38
-
39
-
40
-
41
-
42
-
43
-
44
-
45
-
46
-
47
-
48
-
49
-
50
-
51
-
52
-
 53
53 -
 54
54 -
 55
55 -
 56
56 -
 57
57 -
 58
58 -
 59
59 -
 60
60 -
 61
61 -
 62
62 -
 63
63 -
 64
64 -
 65
65 -
 66
66 -
 67
67 -
 68
68 -
 69
69 -
 70
70 -
 71
71 -
 72
72 -
 73
73 -
74
-
75
-
76
-
77
-
78
-
79
-
80
-
81
-
82
-
83
-
84
-
85
-
86
-
87
-
88
-
89
-
90
-
91
-
92
-
93
-
94
-
95
-
96
-
97
-
98
-
99
-
100
-
101
-
102
-
103
-
104
-
105
-
106
-
107
-
108
 |
 |

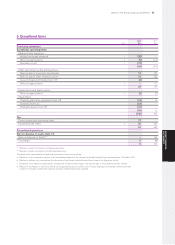
Accounting policies and Notes to the Group financial statements 61
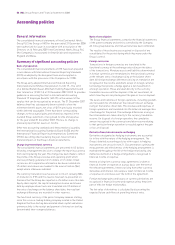
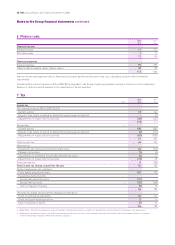
1 Exchange rates
The results of operations have been translated into US dollars
at the average rates of exchange for the year. In the case of
sterling, the translation rate is $1=£0.55 (2007 $1=£0.50). In the
case of the euro, the translation rate is $1=€0.68 (2007 $1=€0.73).
Assets and liabilities have been translated into US dollars at the
rates of exchange on the balance sheet date. In the case of
sterling, the translation rate is $1=£0.69 (2007 $1=£0.50). In the
case of the euro, the translation rate is $1=€0.71 (2007 $1=€0.68).
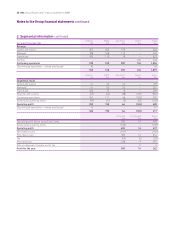
2 Segmental information
The primary segmental reporting format is determined
to be three main geographical regions:
Americas;
Europe, Middle East and Africa (EMEA); and
Asia Pacific.
These, together with Central functions, form the principal format
by which management is organised and makes operational
decisions. Central functions include costs of global functions,
including technology, sales and marketing, finance, human
resources and corporate services; revenue arises principally
from technology fee income.
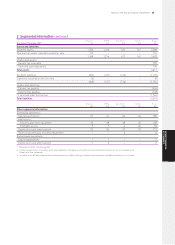
The Group further breaks each geographical region into three
distinct business models which offer different growth, return,
risk and reward opportunities:
Franchised
Where Group companies neither own nor manage the hotel,
but license the use of a Group brand and provide access to
reservations systems, loyalty schemes and know-how. The Group
derives revenues from a brand royalty or licensing fee, based
on a percentage of room revenue.
Managed
Where, in addition to licensing the use of a Group brand, a Group
company manages the hotel for third-party owners. The Group
derives revenues from base and incentive management fees and
provides the system infrastructure necessary for the hotel to
operate. Management contract fees are generally a percentage
of hotel revenue and may have an additional incentive fee linked
to profitability or cash flow. The terms of these agreements vary,
but are often long-term (for example, 10 years or more). The
Group’s responsibilities under the management agreement
typically include hiring, training and supervising the managers
and employees that operate the hotels under the relevant
brand standards. In order to gain access to central reservations
systems, global and regional brand marketing and brand
standards and procedures, owners are typically required
to make a further contribution.
Owned and leased
Where a Group company both owns (or leases) and operates the
hotel and, in the case of ownership, takes all the benefits and
risks associated with ownership.
Segmental results, assets and liabilities include items directly
attributable to a segment as well as those that can be allocated
on a reasonable basis.
Notes to the Group financial statements
GROUP FINANCIAL
STATEMENTS