Holiday Inn 2008 Annual Report Download - page 77
Download and view the complete annual report
Please find page 77 of the 2008 Holiday Inn annual report below. You can navigate through the pages in the report by either clicking on the pages listed below, or by using the keyword search tool below to find specific information within the annual report.-
 1
1 -
2
-
3
-
4
-
5
-
6
-
7
-
8
-
9
-
10
-
11
-
12
-
13
-
14
-
15
-
16
-
17
-
18
-
19
-
20
-
21
-
22
-
23
-
24
-
25
-
26
-
27
-
28
-
29
-
30
-
31
-
32
-
33
-
34
-
35
-
36
-
37
-
38
-
39
-
40
-
41
-
42
-
43
-
44
-
45
-
46
-
47
-
48
-
49
-
50
-
51
-
52
-
53
-
54
-
55
-
56
-
57
-
58
-
59
-
60
-
61
-
62
-
63
-
64
-
65
-
66
-
 67
67 -
 68
68 -
 69
69 -
 70
70 -
 71
71 -
 72
72 -
 73
73 -
 74
74 -
 75
75 -
 76
76 -
 77
77 -
 78
78 -
 79
79 -
 80
80 -
 81
81 -
 82
82 -
 83
83 -
 84
84 -
 85
85 -
 86
86 -
 87
87 -
88
-
89
-
90
-
91
-
92
-
93
-
94
-
95
-
96
-
97
-
98
-
99
-
100
-
101
-
102
-
103
-
104
-
105
-
106
-
107
-
108
 |
 |

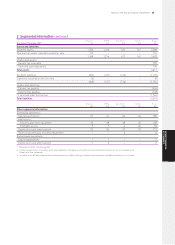
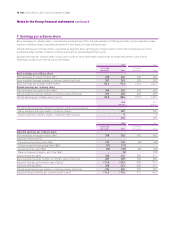
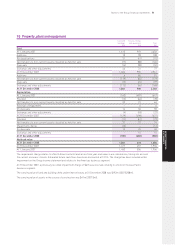
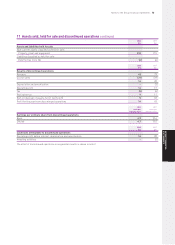
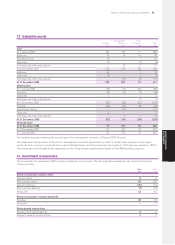
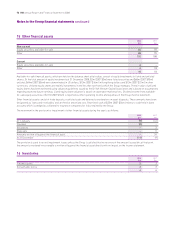
Notes to the Group financial statements 75
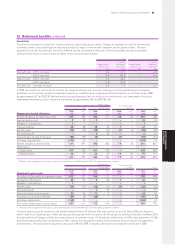
13 Intangible assets
Management Other
Software contracts intangibles Total
$m $m $m $m
Cost
At 1 January 2007 85 229 71 385
Additions 26 10 14 50
Reclassification 10 – – 10
Disposals (1) – (1) (2)
Exchange and other adjustments – 10 2 12
At 31 December 2007 120 249 86 455
Additions 40 – 9 49
Disposals (2) – – (2)
Exchange and other adjustments – (29) (2) (31)
At 31 December 2008 158 220 93 471
Amortisation
At 1 January 2007 (45) (14) (24) (83)
Provided (19) (12) (7) (38)
Disposals 1–12
Exchange and other adjustments – – (1) (1)
At 31 December 2007 (63) (26) (31) (120)
Provided (20) (12) (8) (40)
Impairment charge – (21) – (21)
Disposals 2––2
Exchange and other adjustments – 9 1 10
At 31 December 2008 (81) (50) (38) (169)
Net book value
At 31 December 2008 77 170 55 302
At 31 December 2007 57 223 55 335
At 1 January 2007 40 215 47 302
The weighted average remaining amortisation period for management contracts is 23 years (2007 24 years).
The impairment charge relates to the value of management contracts capitalised as a result of related asset disposals in prior years
and arises from a revision to expected fee income. Estimated future cash flows have been discounted at 12.5% (previous valuation: 10.0%).
The charge has been included within impairment on the Group income statement and relates to the EMEA business segment.
14 Investment in associates
The Group holds five investments (2007 seven) accounted for as associates. The following table summarises the financial information
of the associates:
2008 2007
$m $m
Share of associates’ balance sheet
Current assets 56
Non-current assets 65 104
Current liabilities (20) (16)
Non-current liabilities (7) (29)
Net assets 43 65
Share of associates’ revenue and profit
Revenue 30 32
Net profit –2
Related party transactions
Revenue from related parties 56
Amounts owed by related parties 22
GROUP FINANCIAL
STATEMENTS