Holiday Inn 2008 Annual Report Download - page 12
Download and view the complete annual report
Please find page 12 of the 2008 Holiday Inn annual report below. You can navigate through the pages in the report by either clicking on the pages listed below, or by using the keyword search tool below to find specific information within the annual report.-
 1
1 -
 2
2 -
 3
3 -
 4
4 -
 5
5 -
 6
6 -
 7
7 -
 8
8 -
 9
9 -
 10
10 -
 11
11 -
 12
12 -
 13
13 -
 14
14 -
 15
15 -
 16
16 -
 17
17 -
 18
18 -
 19
19 -
 20
20 -
 21
21 -
 22
22 -
23
-
24
-
25
-
26
-
27
-
28
-
29
-
30
-
31
-
32
-
33
-
34
-
35
-
36
-
37
-
38
-
39
-
40
-
41
-
42
-
43
-
44
-
45
-
46
-
47
-
48
-
49
-
50
-
51
-
52
-
53
-
54
-
55
-
56
-
57
-
58
-
59
-
60
-
61
-
62
-
63
-
64
-
65
-
66
-
67
-
68
-
69
-
70
-
71
-
72
-
73
-
74
-
75
-
76
-
77
-
78
-
79
-
80
-
81
-
82
-
83
-
84
-
85
-
86
-
87
-
88
-
89
-
90
-
91
-
92
-
93
-
94
-
95
-
96
-
97
-
98
-
99
-
100
-
101
-
102
-
103
-
104
-
105
-
106
-
107
-
108
 |
 |

10 IHG Annual Report and Financial Statements 2008
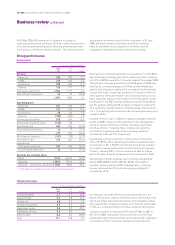
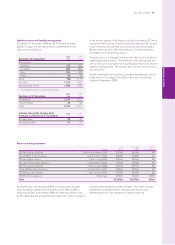
Group performance
Group results
12 months ended 31 December
2008 2007 %
$m $m change
Revenue
Americas 920 902 2.0
EMEA 518 492 5.3
Asia Pacific 290 260 11.5
Central 126 117 7.7
Continuing operations 1,854 1,771 4.7
Discontinued operations 43 79 (45.6)
1,897 1,850 2.5
Operating profit
Americas 451 440 2.5
EMEA 171 134 27.6
Asia Pacific 68 63 7.9
Central (155) (163) 4.9
Continuing operations 535 474 12.9
Exceptional operating items (132) 60 –
Operating profit 403 534 (24.5)
Discontinued operations 14 17 (17.6)
417 551 (24.3)
Net financial expenses (101) (90) (12.2)
Profit before tax* 316 461 (31.5)
Analysed as:
Continuing operations 302 444 (32.0)
Discontinued operations 14 17 (17.6)
Earnings per ordinary share
Basic 91.3¢ 144.7¢ (36.9)
Adjusted 120.9¢ 97.2¢ 24.4
Adjusted – continuing operations 117.8¢ 93.8¢ 25.6
* Profit before tax includes the results of discontinued operations.
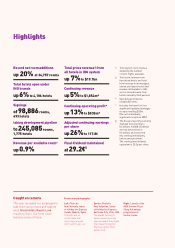
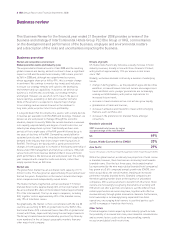
Revenue from continuing operations increased by 4.7% to $1,854m
and continuing operating profit before exceptional items increased
by 12.9% to $535m during the 12 months ended 31 December 2008.
The growth in revenues was driven by RevPAR gains in EMEA and
Asia Pacific, continued expansion in China and the Middle East
and the first full year of trading at the re-opened InterContinental
London Park Lane. Growth was achieved in all regions in the first
three quarters of the year however, the worldwide financial crisis
had a significant impact on the results for the final quarter. In the
fourth quarter, RevPAR declined sharply across the Group falling
by 6.5% globally, although IHG’s brands continued to outperform
their segments in all key markets. Strong revenue conversion led
to a 2.1 percentage point increase in the continuing operating profit
margin to 28.9%.
Included in these results is $33m of liquidated damages received
by IHG in 2008 in respect of the settlement of two management
contracts and two franchise contracts, including one portfolio
franchise contract. Excluding these, revenue and operating
profit before exceptional items from continuing operations
increased by 2.8% and 5.9% respectively.
Including discontinued operations, total revenue increased by
2.5% to $1,897m whilst operating profit before exceptional items
increased by 11.8% to $549m. Discontinued operations included
the results of owned and leased hotels that have been disposed
of since 1 January 2007, or those classified as held for sale as
part of the asset disposal programme that commenced in 2003.
The average US dollar exchange rate to sterling strengthened
during 2008 (2008 $1=£0.55, 2007 $1=£0.50). Translated at
constant currency, applying 2007 exchange rates, continuing
revenue increased by 4.3% and continuing operating profit
increased by 10.3%.
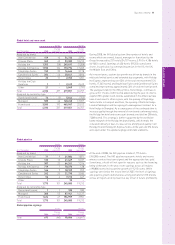
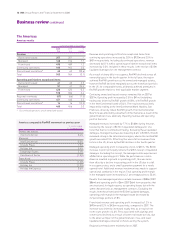
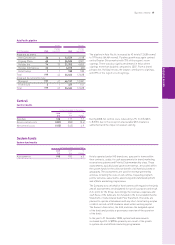
Total gross revenue
12 months ended 31 December
2008 2007 %
$bn $bn change
InterContinental 4.1 3.7 10.8
Crowne Plaza 3.2 2.8 14.3
Holiday Inn 6.8 6.7 1.5
Holiday Inn Express 3.9 3.5 11.4
Staybridge Suites 0.4 0.3 33.3
Candlewood Suites 0.3 0.3 –
Other brands 0.4 0.5 (20.0)
Total 19.1 17.8 7.3
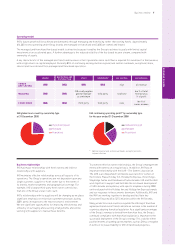
One measure of overall IHG hotel system performance is the
growth in total gross revenue, defined as total room revenue from
franchised hotels and total hotel revenue from managed, owned
and leased hotels. Total gross revenue is not revenue attributable
to IHG, as it is derived mainly from hotels owned by third parties.
Total gross revenue increased by 7.3% from $17.8bn in 2007 to
$19.1bn in 2008, with growth levels achieved across IHG’s key
brands reflecting hotel performance and room growth. Translated
at constant currency, total gross revenue increased by 6.2%.
On 30 May 2008, IHG announced its intention to change its
reporting currency from sterling to US dollars reflecting the profile
of its revenue and operating profit, which are primarily generated
in US dollars or US dollar-linked currencies. This change was first
introduced in the interim results for the six months to 30 June
2008, and these financial statements are IHG’s first annual
financial statements to be presented in US dollars and all
comparative information has been restated accordingly.
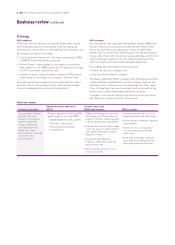
Business review continued