Holiday Inn 2008 Annual Report Download - page 105
Download and view the complete annual report
Please find page 105 of the 2008 Holiday Inn annual report below. You can navigate through the pages in the report by either clicking on the pages listed below, or by using the keyword search tool below to find specific information within the annual report.-
 1
1 -
2
-
3
-
4
-
5
-
6
-
7
-
8
-
9
-
10
-
11
-
12
-
13
-
14
-
15
-
16
-
17
-
18
-
19
-
20
-
21
-
22
-
23
-
24
-
25
-
26
-
27
-
28
-
29
-
30
-
31
-
32
-
33
-
34
-
35
-
36
-
37
-
38
-
39
-
40
-
41
-
42
-
43
-
44
-
45
-
46
-
47
-
48
-
49
-
50
-
51
-
52
-
53
-
54
-
55
-
56
-
57
-
58
-
59
-
60
-
61
-
62
-
63
-
64
-
65
-
66
-
67
-
68
-
69
-
70
-
71
-
72
-
73
-
74
-
75
-
76
-
77
-
78
-
79
-
80
-
81
-
82
-
83
-
84
-
85
-
86
-
87
-
88
-
89
-
90
-
91
-
92
-
93
-
94
-
 95
95 -
 96
96 -
 97
97 -
 98
98 -
 99
99 -
 100
100 -
 101
101 -
 102
102 -
 103
103 -
 104
104 -
 105
105 -
 106
106 -
 107
107 -
 108
108
 |
 |

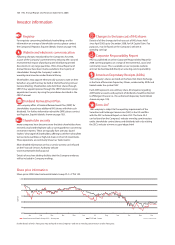
USEFUL INFORMATION
Glossary, Shareholder profiles and Forward-looking statements 103
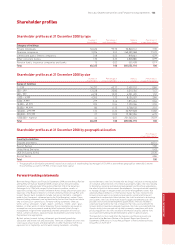
Shareholder profiles
Shareholder profile as at 31 December 2008 by type
Number of Percentage of Ordinary Percentage of
shareholders total shareholders shares issued share capital
Category of holdings
Private individuals 56,436 93.70 20,840,141 7.30
Nominee companies 3,326 5.52 260,509,068 91.23
Limited and public limited companies 318 0.53 818,661 0.29
Other corporate bodies 130 0.23 2,828,885 0.99
Pension funds, insurance companies and banks 15 0.02 555,438 0.19
Total 60,225 100 285,552,193 100
Shareholder profile as at 31 December 2008 by size
Number of Percentage of Ordinary Percentage of
shareholders total shareholders shares issued share capital
Range of holdings
1 – 199 36,237 60.17 2,409,152 0.84
200 – 499 12,528 20.80 4,010,766 1.41
500 – 999 6,218 10.33 4,351,495 1.52
1,000 – 4,999 4,355 7.23 8,105,507 2.84
5,000 -9,999 279 0.46 1,874,264 0.66
10,000 – 49,999 325 0.54 7,290,186 2.55
50,000 – 99,999 80 0.13 5,738,133 2.01
100,000 – 499,999 132 0.22 30,929,828 10.83
500,000 – 999,999 27 0.05 19,282,336 6.75
1,000,000 – highest 44 0.07 201,560,526 70.59
Total 60,225 100 285,552,193 100
Shareholder profile as at 31 December 2008 by geographical location
Percentage of
issued share capital1
Country/Jurisdiction
England and Wales 60.51
Rest of Europe 7.00
United Arab Emirates 5.43
USA (including ADRs) 22.20
Rest of World 4.86
Total 100
1 The geographical distribution presented is based on an analysis of shareholdings (by manager) of 150,000 or above where geographical ownership is known.
These holdings account for 78.95% of total issued share capital.
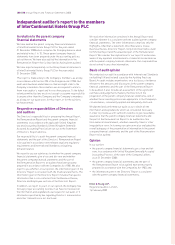
Forward-looking statements
Both the Annual Report and Financial Statements 2008 and the Annual Review
and Summary Financial Statement 2008 contain certain forward-looking
statements as defined under US legislation (Section 21E of the Securities
Exchange Act of 1934) with respect to the financial condition, results of
operations and business of InterContinental Hotels Group and certain plans and
objectives of the Board of Directors of InterContinental Hotels Group PLC with
respect thereto. Such statements include, but are not limited to, statements
made in the Chairman’s statement and in the Chief Executive’s review. These
forward-looking statements can be identified by the fact that they do not relate
only to historical or current facts. Forward-looking statements often use
words such as ‘anticipate’, ‘target’, ‘expect’, ‘estimate’, ‘intend’, ‘plan’, ‘goal’,
‘believe’, or other words of similar meaning. These statements are based on
assumptions and assessments made by InterContinental Hotels Group’s
management in light of their experience and their perception of historical
trends, current conditions, expected future developments and other factors
they believe to be appropriate.
By their nature, forward-looking statements are inherently predictive,
speculative and involve risk and uncertainty. There are a number of factors that
could cause actual results and developments to differ materially from those
expressed in, or implied by, such forward-looking statements, including,
but not limited to: the risks involved with the Group’s reliance on the reputation
of its brands and protection of its intellectual property rights; the risks relating
to identifying, securing and retaining management and franchise agreements;
the effect of political and economic developments; the organisational capability
to manage changes in key personnel and senior management; events that
adversely impact domestic or international travel; the risks involved in the
Group’s reliance upon its proprietary reservations system and increased
competition in reservations infrastructure; the risks in relation to technology
and systems; the risks of the hotel industry supply and demand cycle; the
possible lack of selected development opportunities; the risks related to
corporate responsibility; the risk of litigation; the risks associated with the
Group’s ability to maintain adequate insurance; the risks associated with the
Group’s ability to borrow and satisfy debt covenants; compliance with data
privacy regulations; the risks related to information security; and the risks
associated with funding the defined benefits under its pension plans.
The main factors that could affect the business and financial results are
described in the Business Review of the Annual Report and Financial
Statements 2008 and also in any Annual Report of InterContinental Hotels
Group PLC on Form 20-F.