Holiday Inn 2008 Annual Report Download - page 76
Download and view the complete annual report
Please find page 76 of the 2008 Holiday Inn annual report below. You can navigate through the pages in the report by either clicking on the pages listed below, or by using the keyword search tool below to find specific information within the annual report.-
 1
1 -
2
-
3
-
4
-
5
-
6
-
7
-
8
-
9
-
10
-
11
-
12
-
13
-
14
-
15
-
16
-
17
-
18
-
19
-
20
-
21
-
22
-
23
-
24
-
25
-
26
-
27
-
28
-
29
-
30
-
31
-
32
-
33
-
34
-
35
-
36
-
37
-
38
-
39
-
40
-
41
-
42
-
43
-
44
-
45
-
46
-
47
-
48
-
49
-
50
-
51
-
52
-
53
-
54
-
55
-
56
-
57
-
58
-
59
-
60
-
61
-
62
-
63
-
64
-
65
-
 66
66 -
 67
67 -
 68
68 -
 69
69 -
 70
70 -
 71
71 -
 72
72 -
 73
73 -
 74
74 -
 75
75 -
 76
76 -
 77
77 -
 78
78 -
 79
79 -
 80
80 -
 81
81 -
 82
82 -
 83
83 -
 84
84 -
 85
85 -
 86
86 -
87
-
88
-
89
-
90
-
91
-
92
-
93
-
94
-
95
-
96
-
97
-
98
-
99
-
100
-
101
-
102
-
103
-
104
-
105
-
106
-
107
-
108
 |
 |

74 IHG Annual Report and Financial Statements 2008
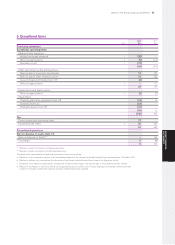
12 Goodwill
2008 2007
$m $m
At 1 January 221 214
Impairment charge (63) –
Exchange and other adjustments (15) 7
At 31 December 143 221
Goodwill arising on business combinations that occurred before 1 January 2005 was not restated on adoption of IFRS as permitted by IFRS 1.
Goodwill has been allocated to cash-generating units (CGUs) for impairment testing as follows:
2008 2007
$m $m
Americas managed operations 78* 141
Asia Pacific managed and franchised operations 65 80
143 221
* $141m before impairment charge.
The Group tests goodwill for impairment annually, or more frequently if there are any indications that an impairment may have arisen.
The recoverable amounts of the CGUs are determined from value in use calculations. These calculations use pre-tax cash flow forecasts
derived from the most recent financial budgets approved by management for the next year and extrapolate cash flows for the following
four years using growth rates based on management expectations and industry growth forecasts. After this period, the terminal value of
future cash flows is calculated based on perpetual growth rates that do not exceed the average long-term growth rates for the relevant
markets. The cash flows are discounted using management estimates of the pre-tax rates that reflect current market assessments of
the time value of money and the risks specific to the CGUs.
The key assumptions used for the value in use calculations are as follows:
Year 2 to 5 growth rates Perpetual growth rates Discount rates
2008 2007 2008 2007 2008 2007
%%%%%%
Americas managed operations 1.0-4.0 4.0 2.7 2.7 12.5 10.0
Asia Pacific managed and franchised operations 2.5-10.0 15.0 4.0 4.0 16.0 11.0
The impairment charge arises in respect of the Americas managed operations CGU reflecting revised fee expectations in light of the
current economic climate. The charge has been included within impairment on the Group income statement and relates to the Americas
business segment.
At 31 December 2008, the recoverable amount of the Americas managed operations equalled its carrying value and consequently any
adverse change in key assumptions would cause the carrying value of the CGU to exceed its recoverable amount. In respect of the Asia
Pacific managed and franchised operations CGU, management believe that the carrying value of the CGU would only exceed its recoverable
amount in the event of highly unlikely changes in the key assumptions.
Notes to the Group financial statements continued