Holiday Inn 2008 Annual Report Download - page 56
Download and view the complete annual report
Please find page 56 of the 2008 Holiday Inn annual report below. You can navigate through the pages in the report by either clicking on the pages listed below, or by using the keyword search tool below to find specific information within the annual report.-
 1
1 -
2
-
3
-
4
-
5
-
6
-
7
-
8
-
9
-
10
-
11
-
12
-
13
-
14
-
15
-
16
-
17
-
18
-
19
-
20
-
21
-
22
-
23
-
24
-
25
-
26
-
27
-
28
-
29
-
30
-
31
-
32
-
33
-
34
-
35
-
36
-
37
-
38
-
39
-
40
-
41
-
42
-
43
-
44
-
45
-
 46
46 -
 47
47 -
 48
48 -
 49
49 -
 50
50 -
 51
51 -
 52
52 -
 53
53 -
 54
54 -
 55
55 -
 56
56 -
 57
57 -
 58
58 -
 59
59 -
 60
60 -
 61
61 -
 62
62 -
 63
63 -
 64
64 -
 65
65 -
 66
66 -
67
-
68
-
69
-
70
-
71
-
72
-
73
-
74
-
75
-
76
-
77
-
78
-
79
-
80
-
81
-
82
-
83
-
84
-
85
-
86
-
87
-
88
-
89
-
90
-
91
-
92
-
93
-
94
-
95
-
96
-
97
-
98
-
99
-
100
-
101
-
102
-
103
-
104
-
105
-
106
-
107
-
108
 |
 |

54 IHG Annual Report and Financial Statements 2008
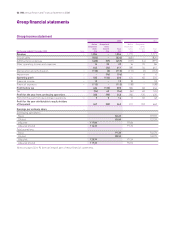
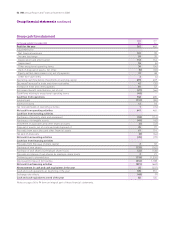
Group cash flow statement
2008 2007
For the year ended 31 December 2008 $m $m
Profit for the year 262 463
Adjustments for:
Net financial expenses 101 90
Income tax charge 59 30
Depreciation and amortisation 112 116
Impairment 96 (6)
Other exceptional operating items 34 (56)
Gain on disposal of assets, net of tax (5) (32)
Equity-settled share-based cost, net of payments 31 48
Other non-cash items 3(4)
Operating cash flow before movements in working capital 693 649
Decrease/(increase) in trade and other receivables 42 (30)
Increase in trade and other payables 81 52
Retirement benefit contributions, net of cost (27) (66)
Cash flows relating to exceptional operating items (49) –
Cash flow from operations 740 605
Interest paid (112) (84)
Interest received 12 18
Tax received/(paid) on operating activities 1(74)
Net cash from operating activities 641 465
Cash flow from investing activities
Purchases of property, plant and equipment (53) (114)
Purchases of intangible assets (49) (40)
Investment in associates and other financial assets (6) (32)
Disposal of assets, net of costs and cash disposed of 25 97
Proceeds from associates and other financial assets 61 114
Tax paid on disposals (3) (64)
Net cash from investing activities (25) (39)
Cash flow from financing activities
Proceeds from the issue of share capital 232
Purchase of own shares (139) (162)
Purchase of own shares by employee share trusts (22) (138)
Proceeds on release of own shares by employee share trusts 221
Dividends paid to shareholders (118) (1,524)
(Decrease)/increase in borrowings (316) 1,108
Net cash from financing activities (591) (663)
Net movement in cash and cash equivalents in the year 25 (237)
Cash and cash equivalents at beginning of the year 105 351
Exchange rate effects (48) (9)
Cash and cash equivalents at end of the year 82 105
Notes on pages 56 to 94 form an integral part of these financial statements.
Group financial statements continued