Hertz 2012 Annual Report Download - page 99
Download and view the complete annual report
Please find page 99 of the 2012 Hertz annual report below. You can navigate through the pages in the report by either clicking on the pages listed below, or by using the keyword search tool below to find specific information within the annual report.-
 1
1 -
2
-
3
-
4
-
5
-
6
-
7
-
8
-
9
-
10
-
11
-
12
-
13
-
14
-
15
-
16
-
17
-
18
-
19
-
20
-
21
-
22
-
23
-
24
-
25
-
26
-
27
-
28
-
29
-
30
-
31
-
32
-
33
-
34
-
35
-
36
-
37
-
38
-
39
-
40
-
41
-
42
-
43
-
44
-
45
-
46
-
47
-
48
-
49
-
50
-
51
-
52
-
53
-
54
-
55
-
56
-
57
-
58
-
59
-
60
-
61
-
62
-
63
-
64
-
65
-
66
-
67
-
68
-
69
-
70
-
71
-
72
-
73
-
74
-
75
-
76
-
77
-
78
-
79
-
80
-
81
-
82
-
83
-
84
-
85
-
86
-
87
-
88
-
 89
89 -
 90
90 -
 91
91 -
 92
92 -
 93
93 -
 94
94 -
 95
95 -
 96
96 -
 97
97 -
 98
98 -
 99
99 -
 100
100 -
 101
101 -
 102
102 -
 103
103 -
 104
104 -
 105
105 -
 106
106 -
 107
107 -
 108
108 -
 109
109 -
110
-
111
-
112
-
113
-
114
-
115
-
116
-
117
-
118
-
119
-
120
-
121
-
122
-
123
-
124
-
125
-
126
-
127
-
128
-
129
-
130
-
131
-
132
-
133
-
134
-
135
-
136
-
137
-
138
-
139
-
140
-
141
-
142
-
143
-
144
-
145
-
146
-
147
-
148
-
149
-
150
-
151
-
152
-
153
-
154
-
155
-
156
-
157
-
158
-
159
-
160
-
161
-
162
-
163
-
164
-
165
-
166
-
167
-
168
-
169
-
170
-
171
-
172
-
173
-
174
-
175
-
176
-
177
-
178
-
179
-
180
-
181
-
182
-
183
-
184
-
185
-
186
-
187
-
188
-
189
-
190
-
191
-
192
-
193
-
194
-
195
-
196
-
197
-
198
-
199
-
200
-
201
-
202
-
203
-
204
-
205
-
206
-
207
-
208
-
209
-
210
-
211
-
212
-
213
-
214
-
215
-
216
-
217
-
218
-
219
-
220
-
221
-
222
-
223
-
224
-
225
-
226
-
227
-
228
-
229
-
230
-
231
-
232
-
233
-
234
-
235
-
236
-
237
-
238
 |
 |
ITEM 7. MANAGEMENT’S DISCUSSION AND ANALYSIS OF FINANCIAL CONDITION AND
RESULTS OF OPERATIONS (Continued)
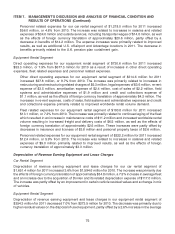
Personnel related expenses for our car rental segment of $1,218.0 million for 2011 increased
$56.0 million, or 4.8% from 2010. The increase was related to increases in salaries and related
expenses of $34.0 million and outside services, including transporter wages of $14.8 million, as well
as the effects of foreign currency translation of approximately $20.6 million, partly offset by a
decrease in benefits of $14.2 million. The expense increases were primarily related to improved
results, as well as additional U.S. off-airport and Advantage locations in 2011. The decrease in
benefits primarily related to the U.K. pension plan curtailment gain.
Equipment Rental Segment
Direct operating expenses for our equipment rental segment of $730.6 million for 2011 increased
$53.3 million, or 7.9% from $677.3 million for 2010 as a result of increases in other direct operating
expenses, fleet related expenses and personnel related expenses.
Other direct operating expenses for our equipment rental segment of $314.6 million for 2011
increased $27.8 million, or 9.7% from 2010. The increase was primarily related to increases in
restructuring and restructuring related charges of $5.3 million, legal expenses of $3.6 million, re-rent
expense of $3.5 million, amortization expense of $2.4 million, cost of sales of $2.2 million, field
systems and administrative expenses of $1.9 million and credit and collections expense of
$1.1 million, as well as the effects of foreign currency translation of approximately $4.2 million. The
increases in re-rent expense, costs of sales, field systems and administrative expenses and credit
and collections expense primarily related to improved worldwide rental volume demand.
Fleet related expenses for our equipment rental segment of $193.8 million for 2011 increased
$13.1 million, or 7.2% from 2010. The increase was primarily related to continued aging of the fleet
which resulted in an increase in maintenance costs of $11.2 million and increased worldwide rental
volume resulting in increased freight and delivery costs of $6.5 million, as well as the effects of
foreign currency translation of approximately $2.6 million. These increases were partly offset by
decreases in insurance and licenses of $3.8 million and personal property taxes of $2.6 million.
Personnel related expenses for our equipment rental segment of $222.2 million for 2011 increased
$12.4 million, or 5.9% from 2010. The increase was related to increases in salaries and related
expenses of $9.0 million primarily related to improved results, as well as the effects of foreign
currency translation of approximately $3.3 million.
Depreciation of Revenue Earning Equipment and Lease Charges
Car Rental Segment
Depreciation of revenue earning equipment and lease charges for our car rental segment of
$1,651.4 million for 2011 increased 3.6% from $1,594.6 million for 2010. The increase was primarily due
the effects of foreign currency translation of approximately $34.8 million, a 7.5% increase in average fleet
and an increase due to the acquisition of Donlen and its related depreciation expense of $117.0 million.
The increase was partly offset by an improvement in certain vehicle residual values and a change in mix
of vehicles.
Equipment Rental Segment
Depreciation of revenue earning equipment and lease charges in our equipment rental segment of
$254.3 million for 2011 decreased 7.0% from $273.5 million for 2010. The decrease was primarily due to
higher residual values on the disposal of used equipment, partly offset by a 2.6% increase in the average
75