Hertz 2012 Annual Report Download - page 161
Download and view the complete annual report
Please find page 161 of the 2012 Hertz annual report below. You can navigate through the pages in the report by either clicking on the pages listed below, or by using the keyword search tool below to find specific information within the annual report.-
 1
1 -
2
-
3
-
4
-
5
-
6
-
7
-
8
-
9
-
10
-
11
-
12
-
13
-
14
-
15
-
16
-
17
-
18
-
19
-
20
-
21
-
22
-
23
-
24
-
25
-
26
-
27
-
28
-
29
-
30
-
31
-
32
-
33
-
34
-
35
-
36
-
37
-
38
-
39
-
40
-
41
-
42
-
43
-
44
-
45
-
46
-
47
-
48
-
49
-
50
-
51
-
52
-
53
-
54
-
55
-
56
-
57
-
58
-
59
-
60
-
61
-
62
-
63
-
64
-
65
-
66
-
67
-
68
-
69
-
70
-
71
-
72
-
73
-
74
-
75
-
76
-
77
-
78
-
79
-
80
-
81
-
82
-
83
-
84
-
85
-
86
-
87
-
88
-
89
-
90
-
91
-
92
-
93
-
94
-
95
-
96
-
97
-
98
-
99
-
100
-
101
-
102
-
103
-
104
-
105
-
106
-
107
-
108
-
109
-
110
-
111
-
112
-
113
-
114
-
115
-
116
-
117
-
118
-
119
-
120
-
121
-
122
-
123
-
124
-
125
-
126
-
127
-
128
-
129
-
130
-
131
-
132
-
133
-
134
-
135
-
136
-
137
-
138
-
139
-
140
-
141
-
142
-
143
-
144
-
145
-
146
-
147
-
148
-
149
-
150
-
 151
151 -
 152
152 -
 153
153 -
 154
154 -
 155
155 -
 156
156 -
 157
157 -
 158
158 -
 159
159 -
 160
160 -
 161
161 -
 162
162 -
 163
163 -
 164
164 -
 165
165 -
 166
166 -
 167
167 -
 168
168 -
 169
169 -
 170
170 -
 171
171 -
172
-
173
-
174
-
175
-
176
-
177
-
178
-
179
-
180
-
181
-
182
-
183
-
184
-
185
-
186
-
187
-
188
-
189
-
190
-
191
-
192
-
193
-
194
-
195
-
196
-
197
-
198
-
199
-
200
-
201
-
202
-
203
-
204
-
205
-
206
-
207
-
208
-
209
-
210
-
211
-
212
-
213
-
214
-
215
-
216
-
217
-
218
-
219
-
220
-
221
-
222
-
223
-
224
-
225
-
226
-
227
-
228
-
229
-
230
-
231
-
232
-
233
-
234
-
235
-
236
-
237
-
238
 |
 |

HERTZ GLOBAL HOLDINGS, INC. AND SUBSIDIARIES
NOTES TO CONSOLIDATED FINANCIAL STATEMENTS (Continued)
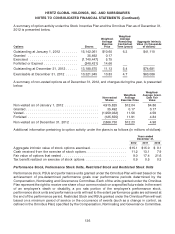
A summary of RSU and PSU activity under the Omnibus Plan as of December 31, 2012 is presented
below.
Weighted- Aggregate Intrinsic
Average Value (In thousands
Shares Fair Value of dollars)
Outstanding at January 1, 2012 .................. 4,327,461 $ 6.46 $50,718
Granted ................................... 869,894 13.78 —
Vested .................................... (3,198,219) 4.58 —
Forfeited or Expired ........................... (126,502) 13.19 —
Outstanding at December 31, 2012 ................ 1,872,634 $12.62 $30,468
Additional information pertaining to RSU and PSU activity is as follows:
Years ended December 31,
2012 2011 2010
Total fair value of awards that vested ($ millions) ................ $ 14.6 $ 9.6 $ 8.2
Weighted average grant date fair value of awards ............... $13.78 $14.78 $10.1
Compensation expense for RSUs and PSUs is based on the grant date fair value, and is recognized
ratably over the vesting period. For grants in 2010, 2011 and 2012, the vesting period is three years (for
grants in 2010 and 2011, 25% in the first year, 25% in the second year and 50% in the third year and for
grants in 2012, 331⁄3% per year). In addition to the service vesting condition, the PSUs had an additional
vesting condition which called for the number of units that will be awarded being based on achievement
of a certain level of Corporate EBITDA over the applicable measurement period.
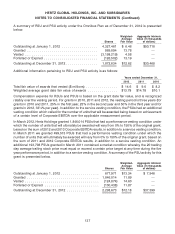
In March 2012, Hertz Holdings granted 1,846,014 PSUs that had a performance vesting condition under
which the number of units that will ultimately be awarded will vary from 0% to 150% of the original grant,
based on the sum of 2012 and 2013 Corporate EBITDA results, in addition to a service vesting condition.
In March 2011 we granted 499,515 PSUs that had a performance vesting condition under which the
number of units that will ultimately be awarded will vary from 0% to 150% of the original grant, based on
the sum of 2011 and 2012 Corporate EBITDA results, in addition to a service vesting condition. An
additional 193,798 PSUs granted in March 2011 contained a market condition whereby the 20 trading
day average trailing stock price must equal or exceed a certain price target at any time during the five
year performance period, in addition to a service vesting condition. A summary of the PSU activity for this
grant is presented below.
Weighted- Aggregate Intrinsic
Average Value (In thousands
Shares Fair Value of dollars)
Outstanding at January 1, 2012 ................... 677,971 $13.34 $ 7,946
Granted .................................... 1,846,014 11.89 —
Vested ..................................... (124,874) 14.60 —
Forfeited or Expired ........................... (100,438) 11.87 —
Outstanding at December 31, 2012 ................ 2,298,673 $12.18 $37,399
137