Hertz 2012 Annual Report Download - page 169
Download and view the complete annual report
Please find page 169 of the 2012 Hertz annual report below. You can navigate through the pages in the report by either clicking on the pages listed below, or by using the keyword search tool below to find specific information within the annual report.-
 1
1 -
2
-
3
-
4
-
5
-
6
-
7
-
8
-
9
-
10
-
11
-
12
-
13
-
14
-
15
-
16
-
17
-
18
-
19
-
20
-
21
-
22
-
23
-
24
-
25
-
26
-
27
-
28
-
29
-
30
-
31
-
32
-
33
-
34
-
35
-
36
-
37
-
38
-
39
-
40
-
41
-
42
-
43
-
44
-
45
-
46
-
47
-
48
-
49
-
50
-
51
-
52
-
53
-
54
-
55
-
56
-
57
-
58
-
59
-
60
-
61
-
62
-
63
-
64
-
65
-
66
-
67
-
68
-
69
-
70
-
71
-
72
-
73
-
74
-
75
-
76
-
77
-
78
-
79
-
80
-
81
-
82
-
83
-
84
-
85
-
86
-
87
-
88
-
89
-
90
-
91
-
92
-
93
-
94
-
95
-
96
-
97
-
98
-
99
-
100
-
101
-
102
-
103
-
104
-
105
-
106
-
107
-
108
-
109
-
110
-
111
-
112
-
113
-
114
-
115
-
116
-
117
-
118
-
119
-
120
-
121
-
122
-
123
-
124
-
125
-
126
-
127
-
128
-
129
-
130
-
131
-
132
-
133
-
134
-
135
-
136
-
137
-
138
-
139
-
140
-
141
-
142
-
143
-
144
-
145
-
146
-
147
-
148
-
149
-
150
-
151
-
152
-
153
-
154
-
155
-
156
-
157
-
158
-
 159
159 -
 160
160 -
 161
161 -
 162
162 -
 163
163 -
 164
164 -
 165
165 -
 166
166 -
 167
167 -
 168
168 -
 169
169 -
 170
170 -
 171
171 -
 172
172 -
 173
173 -
 174
174 -
 175
175 -
 176
176 -
 177
177 -
 178
178 -
 179
179 -
180
-
181
-
182
-
183
-
184
-
185
-
186
-
187
-
188
-
189
-
190
-
191
-
192
-
193
-
194
-
195
-
196
-
197
-
198
-
199
-
200
-
201
-
202
-
203
-
204
-
205
-
206
-
207
-
208
-
209
-
210
-
211
-
212
-
213
-
214
-
215
-
216
-
217
-
218
-
219
-
220
-
221
-
222
-
223
-
224
-
225
-
226
-
227
-
228
-
229
-
230
-
231
-
232
-
233
-
234
-
235
-
236
-
237
-
238
 |
 |

HERTZ GLOBAL HOLDINGS, INC. AND SUBSIDIARIES
NOTES TO CONSOLIDATED FINANCIAL STATEMENTS (Continued)
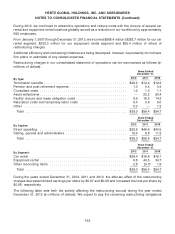
Years ended December 31,
2012 2011 2010
Revenue earning equipment and property and equipment
Car rental
Expenditures ............................................. $9,118.3 $ 9,109.9 $ 8,430.1
Proceeds from disposals ..................................... (7,054.4) (7,689.4) (7,432.7)
Net expenditures ......................................... $2,063.9 $ 1,420.5 $ 997.4
Equipment rental
Expenditures ............................................. $ 787.6 $ 617.5 $ 186.1
Proceeds from disposals ..................................... (192.3) (213.8) (124.3)
Net expenditures (proceeds) .................................. $ 595.3 $ 403.7 $ 61.8
Other reconciling items
Expenditures ............................................. $ 20.1 $ 8.6 $ 3.9
Proceeds from disposals ..................................... (16.1) (1.0) (0.3)
Net expenditures ......................................... $ 4.0 $ 7.6 $ 3.6
As of December 31,
2012 2011
Total assets at end of year
Car rental ........................................................ $18,454.2 $13,037.9
Equipment rental ................................................... 3,623.0 3,058.9
Other reconciling items ............................................... 1,208.8 1,576.7
Total .......................................................... $23,286.0 $17,673.5
Revenue earning equipment, net, at end of year
Car rental ........................................................ $10,710.1 $ 8,318.7
Equipment rental ................................................... 2,198.2 1,786.7
Total .......................................................... $12,908.3 $10,105.4
Property and equipment, net, at end of year
Car rental ........................................................ $ 1,111.3 $ 971.3
Equipment rental ................................................... 235.9 203.7
Other reconciling items ............................................... 89.2 76.9
Total .......................................................... $1,436.4 $ 1,251.9
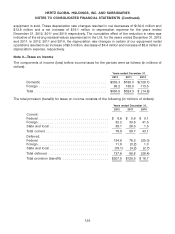
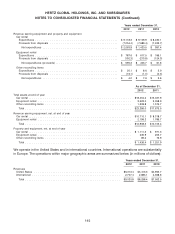
We operate in the United States and in international countries. International operations are substantially
in Europe. The operations within major geographic areas are summarized below (in millions of dollars):
Years ended December 31,
2012 2011 2010
Revenues
United States ............................................... $6,313.4 $5,413.3 $4,993.7
International ................................................ 2,707.4 2,885.1 2,568.8
Total .................................................... $9,020.8 $8,298.4 $7,562.5
145