Hertz 2012 Annual Report Download - page 98
Download and view the complete annual report
Please find page 98 of the 2012 Hertz annual report below. You can navigate through the pages in the report by either clicking on the pages listed below, or by using the keyword search tool below to find specific information within the annual report.-
 1
1 -
2
-
3
-
4
-
5
-
6
-
7
-
8
-
9
-
10
-
11
-
12
-
13
-
14
-
15
-
16
-
17
-
18
-
19
-
20
-
21
-
22
-
23
-
24
-
25
-
26
-
27
-
28
-
29
-
30
-
31
-
32
-
33
-
34
-
35
-
36
-
37
-
38
-
39
-
40
-
41
-
42
-
43
-
44
-
45
-
46
-
47
-
48
-
49
-
50
-
51
-
52
-
53
-
54
-
55
-
56
-
57
-
58
-
59
-
60
-
61
-
62
-
63
-
64
-
65
-
66
-
67
-
68
-
69
-
70
-
71
-
72
-
73
-
74
-
75
-
76
-
77
-
78
-
79
-
80
-
81
-
82
-
83
-
84
-
85
-
86
-
87
-
 88
88 -
 89
89 -
 90
90 -
 91
91 -
 92
92 -
 93
93 -
 94
94 -
 95
95 -
 96
96 -
 97
97 -
 98
98 -
 99
99 -
 100
100 -
 101
101 -
 102
102 -
 103
103 -
 104
104 -
 105
105 -
 106
106 -
 107
107 -
 108
108 -
109
-
110
-
111
-
112
-
113
-
114
-
115
-
116
-
117
-
118
-
119
-
120
-
121
-
122
-
123
-
124
-
125
-
126
-
127
-
128
-
129
-
130
-
131
-
132
-
133
-
134
-
135
-
136
-
137
-
138
-
139
-
140
-
141
-
142
-
143
-
144
-
145
-
146
-
147
-
148
-
149
-
150
-
151
-
152
-
153
-
154
-
155
-
156
-
157
-
158
-
159
-
160
-
161
-
162
-
163
-
164
-
165
-
166
-
167
-
168
-
169
-
170
-
171
-
172
-
173
-
174
-
175
-
176
-
177
-
178
-
179
-
180
-
181
-
182
-
183
-
184
-
185
-
186
-
187
-
188
-
189
-
190
-
191
-
192
-
193
-
194
-
195
-
196
-
197
-
198
-
199
-
200
-
201
-
202
-
203
-
204
-
205
-
206
-
207
-
208
-
209
-
210
-
211
-
212
-
213
-
214
-
215
-
216
-
217
-
218
-
219
-
220
-
221
-
222
-
223
-
224
-
225
-
226
-
227
-
228
-
229
-
230
-
231
-
232
-
233
-
234
-
235
-
236
-
237
-
238
 |
 |

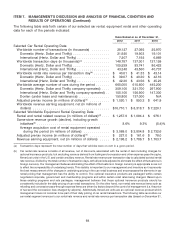
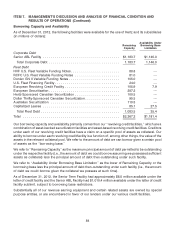
ITEM 7. MANAGEMENT’S DISCUSSION AND ANALYSIS OF FINANCIAL CONDITION AND
RESULTS OF OPERATIONS (Continued)
EXPENSES
Years Ended
December 31,
2011 2010 $ Change % Change
(in millions of dollars)
Expenses:
Fleet related expenses ....................... $1,120.6 $1,003.2 $117.4 11.7%
Personnel related expenses ................... 1,478.0 1,411.2 66.8 4.7%
Other direct operating expenses ................ 1,967.8 1,869.0 98.8 5.3%
Direct operating .......................... 4,566.4 4,283.4 283.0 6.6%
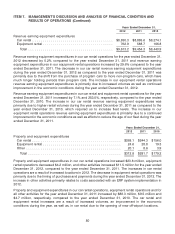
Depreciation of revenue earning equipment and
lease charges ........................ 1,905.7 1,868.1 37.6 2.0%
Selling, general and administrative ............ 745.3 664.5 80.8 12.2%
Interest expense .......................... 699.7 773.4 (73.7) (9.5)%
Interest income .......................... (5.5) (12.3) 6.8 (55.3)%
Other (income) expense, net ................. 62.5 — 62.5 NM
Total expenses ........................ $7,974.1 $7,577.1 $397.0 5.2%
Total expenses increased 5.2%, but total expenses as a percentage of revenues decreased from 100.2%
for the year ended December 31, 2010 to 96.1% for the year ended December 31, 2011.
Direct Operating Expenses
Car Rental Segment
Direct operating expenses for our car rental segment of $3,840.3 million for 2011 increased
$235.6 million, or 6.5%, from 2010 as a result of increases in fleet related expenses, other direct
operating expenses and personnel related expenses.
Fleet related expenses for our car rental segment of $926.8 million for 2011 increased
$104.7 million, or 12.7% from 2010. The increase was primarily related to worldwide rental volume
demand which resulted in increases in gasoline costs of $58.4 million, self insurance expenses of
$10.1 million, vehicle license taxes of $7.4 million, vehicle maintenance costs of $6.2 million and
vehicle registration fees of $5.4 million, as well as the effects of foreign currency translation of
approximately $29.4 million. The increase in gasoline costs also related to higher gasoline prices.
These increases were partly offset by a decrease in vehicle damage costs of $11.5 million.
Other direct operating expenses for our car rental segment of $1,695.5 million for 2011 increased
$74.9 million, or 4.6% from 2010. The increase was primarily related to increases in field
administrative expenses of $23.0 million, customer service costs of $13.8 million, third-party claim
management expenses of $12.9 million, concession fees of $12.8 million, computer costs of
$10.1 million, charge card fees of $4.7 million and reservation costs of $4.3 million, as well as the
effects of foreign currency translation of approximately $36.8 million. The increases were primarily a
result of improved worldwide rental volume demand. The increase in field administrative expenses
also related to a reimbursement received from a manufacturer in 2010. The increases in other direct
operating expenses were partly offset by decreases in facilities expenses of $34.8 million, field
systems of $4.7 million and restructuring and restructuring related charges of $2.8 million. The
decrease in facilities expenses primarily related to gains recognized on the sale of certain properties
in 2011.
74