Hertz 2012 Annual Report Download - page 102
Download and view the complete annual report
Please find page 102 of the 2012 Hertz annual report below. You can navigate through the pages in the report by either clicking on the pages listed below, or by using the keyword search tool below to find specific information within the annual report.-
 1
1 -
2
-
3
-
4
-
5
-
6
-
7
-
8
-
9
-
10
-
11
-
12
-
13
-
14
-
15
-
16
-
17
-
18
-
19
-
20
-
21
-
22
-
23
-
24
-
25
-
26
-
27
-
28
-
29
-
30
-
31
-
32
-
33
-
34
-
35
-
36
-
37
-
38
-
39
-
40
-
41
-
42
-
43
-
44
-
45
-
46
-
47
-
48
-
49
-
50
-
51
-
52
-
53
-
54
-
55
-
56
-
57
-
58
-
59
-
60
-
61
-
62
-
63
-
64
-
65
-
66
-
67
-
68
-
69
-
70
-
71
-
72
-
73
-
74
-
75
-
76
-
77
-
78
-
79
-
80
-
81
-
82
-
83
-
84
-
85
-
86
-
87
-
88
-
89
-
90
-
91
-
 92
92 -
 93
93 -
 94
94 -
 95
95 -
 96
96 -
 97
97 -
 98
98 -
 99
99 -
 100
100 -
 101
101 -
 102
102 -
 103
103 -
 104
104 -
 105
105 -
 106
106 -
 107
107 -
 108
108 -
 109
109 -
 110
110 -
 111
111 -
 112
112 -
113
-
114
-
115
-
116
-
117
-
118
-
119
-
120
-
121
-
122
-
123
-
124
-
125
-
126
-
127
-
128
-
129
-
130
-
131
-
132
-
133
-
134
-
135
-
136
-
137
-
138
-
139
-
140
-
141
-
142
-
143
-
144
-
145
-
146
-
147
-
148
-
149
-
150
-
151
-
152
-
153
-
154
-
155
-
156
-
157
-
158
-
159
-
160
-
161
-
162
-
163
-
164
-
165
-
166
-
167
-
168
-
169
-
170
-
171
-
172
-
173
-
174
-
175
-
176
-
177
-
178
-
179
-
180
-
181
-
182
-
183
-
184
-
185
-
186
-
187
-
188
-
189
-
190
-
191
-
192
-
193
-
194
-
195
-
196
-
197
-
198
-
199
-
200
-
201
-
202
-
203
-
204
-
205
-
206
-
207
-
208
-
209
-
210
-
211
-
212
-
213
-
214
-
215
-
216
-
217
-
218
-
219
-
220
-
221
-
222
-
223
-
224
-
225
-
226
-
227
-
228
-
229
-
230
-
231
-
232
-
233
-
234
-
235
-
236
-
237
-
238
 |
 |

ITEM 7. MANAGEMENT’S DISCUSSION AND ANALYSIS OF FINANCIAL CONDITION AND
RESULTS OF OPERATIONS (Continued)
for which tax benefits cannot be realized. See Note 9 to the Notes to our consolidated financial
statements included in this Annual Report under the caption ‘‘Item 8—Financial Statements and
Supplementary Data.’’
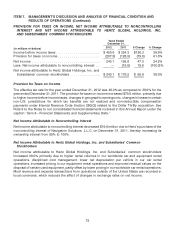
Net Income Attributable to Noncontrolling Interest
Net income attributable to noncontrolling interest increased 12.5% due to an increase in our formerly
majority-owned subsidiary Navigation Solutions, L.L.C.’s net income for 2011 as compared to the year
ended December 31, 2010. In December 2011, Hertz purchased the noncontrolling interest of
Navigation Solutions, L.L.C., thereby increasing its ownership interest from 65% to 100%.
Net Income (Loss) Attributable to Hertz Global Holdings, Inc. and Subsidiaries’ Common
Stockholders
The net income attributable to Hertz Global Holdings, Inc. and Subsidiaries’ common stockholders was
$176.2 million in 2011 compared to a loss in 2010 of $48.7 million primarily due to higher rental volumes
in our worldwide car and equipment rental operations, improved residual values on the disposal of
certain vehicles and used equipment, disciplined cost management, lower interest expense and
increased pricing in our equipment rental operations, partly offset by lower pricing in our worldwide car
rental operations, costs incurred in connection with the refinancing of our Senior Term Facility and
Senior ABL Facility and the write-off of unamortized debt costs and premiums paid in connection with the
redemption of our 10.5% Senior Subordinated Notes and a portion of our 8.875% Senior Notes during
2011. The impact of changes in exchange rates on net income was mitigated by the fact that not only
revenues but also most expenses outside of the United States were incurred in local currencies.
LIQUIDITY AND CAPITAL RESOURCES
Our domestic and international operations are funded by cash provided by operating activities and by
extensive financing arrangements maintained by us in the United States and internationally.
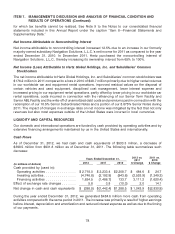
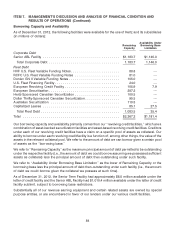
Cash Flows
As of December 31, 2012, we had cash and cash equivalents of $533.3 million, a decrease of
$398.5 million from $931.8 million as of December 31, 2011. The following table summarizes such
decrease:
2012 vs. 2011 vs.
Years Ended December 31, 2011 2010
2012 2011 2010 $ Change $ Change
(in millions of dollars)
Cash provided by (used in):
Operating activities ............... $2,718.0 $ 2,233.4 $2,208.7 $ 484.6 $ 24.7
Investing activities ................ (4,746.8) (2,192.9) (943.6) (2,553.9) (1,249.3)
Financing activities ............... 1,624.5 (1,486.7) 133.7 3,111.2 (1,620.4)
Effect of exchange rate changes ....... 5.8 3.8 (10.3) 2.0 14.1
Net change in cash and cash equivalents $ (398.5) $(1,442.4) $1,388.5 $ 1,043.9 $(2,830.9)
During the year ended December 31, 2012, we generated $484.6 million more cash from operating
activities compared with the same period in 2011. The increase was primarily a result of higher earnings
before interest, depreciation and amortization and reduced interest expense as well as due to the timing
of our payments.
78