Hertz 2012 Annual Report Download - page 91
Download and view the complete annual report
Please find page 91 of the 2012 Hertz annual report below. You can navigate through the pages in the report by either clicking on the pages listed below, or by using the keyword search tool below to find specific information within the annual report.-
 1
1 -
2
-
3
-
4
-
5
-
6
-
7
-
8
-
9
-
10
-
11
-
12
-
13
-
14
-
15
-
16
-
17
-
18
-
19
-
20
-
21
-
22
-
23
-
24
-
25
-
26
-
27
-
28
-
29
-
30
-
31
-
32
-
33
-
34
-
35
-
36
-
37
-
38
-
39
-
40
-
41
-
42
-
43
-
44
-
45
-
46
-
47
-
48
-
49
-
50
-
51
-
52
-
53
-
54
-
55
-
56
-
57
-
58
-
59
-
60
-
61
-
62
-
63
-
64
-
65
-
66
-
67
-
68
-
69
-
70
-
71
-
72
-
73
-
74
-
75
-
76
-
77
-
78
-
79
-
80
-
 81
81 -
 82
82 -
 83
83 -
 84
84 -
 85
85 -
 86
86 -
 87
87 -
 88
88 -
 89
89 -
 90
90 -
 91
91 -
 92
92 -
 93
93 -
 94
94 -
 95
95 -
 96
96 -
 97
97 -
 98
98 -
 99
99 -
 100
100 -
 101
101 -
102
-
103
-
104
-
105
-
106
-
107
-
108
-
109
-
110
-
111
-
112
-
113
-
114
-
115
-
116
-
117
-
118
-
119
-
120
-
121
-
122
-
123
-
124
-
125
-
126
-
127
-
128
-
129
-
130
-
131
-
132
-
133
-
134
-
135
-
136
-
137
-
138
-
139
-
140
-
141
-
142
-
143
-
144
-
145
-
146
-
147
-
148
-
149
-
150
-
151
-
152
-
153
-
154
-
155
-
156
-
157
-
158
-
159
-
160
-
161
-
162
-
163
-
164
-
165
-
166
-
167
-
168
-
169
-
170
-
171
-
172
-
173
-
174
-
175
-
176
-
177
-
178
-
179
-
180
-
181
-
182
-
183
-
184
-
185
-
186
-
187
-
188
-
189
-
190
-
191
-
192
-
193
-
194
-
195
-
196
-
197
-
198
-
199
-
200
-
201
-
202
-
203
-
204
-
205
-
206
-
207
-
208
-
209
-
210
-
211
-
212
-
213
-
214
-
215
-
216
-
217
-
218
-
219
-
220
-
221
-
222
-
223
-
224
-
225
-
226
-
227
-
228
-
229
-
230
-
231
-
232
-
233
-
234
-
235
-
236
-
237
-
238
 |
 |
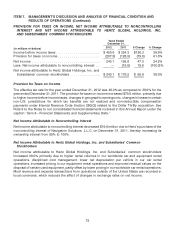
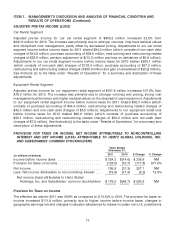
ITEM 7. MANAGEMENT’S DISCUSSION AND ANALYSIS OF FINANCIAL CONDITION AND
RESULTS OF OPERATIONS (Continued)
four months in 2011. We acquired Dollar Thrifty on November 19, 2012. Our results from operations
include Dollar Thrifty for the post-acquisition period ended December 31, 2012, which is approximately
forty three days in 2012. The results of operations for Donlen and Dollar Thrifty are included within our
car rental segment. The acquisitions of Donlen and Dollar Thrifty are referred to below as the ‘‘Recent
Acquisitions.’’ See Note 4 of the Notes to our consolidated financial statements included in this Annual
Report under the caption ‘‘Item 8—Financial Statements and Supplementary Data.’’
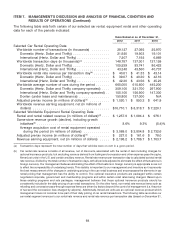
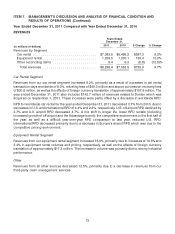
Car Rental Segment
Revenues from our car rental segment increased 7.8%, primarily as a result of increases in car rental
transaction days worldwide of 8.4%, incremental volume associated with the Recent Acquisitions and
refueling fees of $34.9 million. These increases were partly offset by the effects of foreign currency
translation of approximately $140.6 million and a decrease in worldwide RPD.
RPD for worldwide car rental for the year ended December 31, 2012 decreased 3.2% from 2011, due to
decreases in U.S. and International RPD of 3.1% and 2.9%, respectively, and a proportionately higher
amount attributable to the U.S. due to uncertain economic conditions in Europe. U.S. airport RPD
decreased 3.1% and U.S. off-airport RPD declined by 2.7%. U.S. airport RPD was negatively impacted by
a shift to longer life, lower RPD rentals (due to a proportionately higher amount attributable to off-airport).
International RPD decreased primarily due to a decline in Europe’s airport RPD which was due to the
competitive pricing environment and uncertain economic conditions.
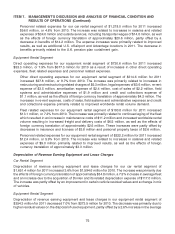
Equipment Rental Segment
Revenues from our equipment rental segment increased 14.5%, primarily due to increases of 12.3% and
3.6% in equipment rental volumes and pricing, respectively, partly offset by the effects of foreign
currency translation of approximately $11.2 million. The increase in volumes were primarily due to strong
industrial performance, especially oil and gas related, and improvement in the construction sector in part
reflecting higher rental penetration. Additionally, Cinelease and other 2012 equipment rental segment
acquisitions contributed to the increase in equipment rental revenues.
Other
Revenues from all other sources decreased $3.0 million, primarily due to a decrease in revenues from
our third-party claim management services.
67