Hertz 2012 Annual Report Download - page 101
Download and view the complete annual report
Please find page 101 of the 2012 Hertz annual report below. You can navigate through the pages in the report by either clicking on the pages listed below, or by using the keyword search tool below to find specific information within the annual report.-
 1
1 -
2
-
3
-
4
-
5
-
6
-
7
-
8
-
9
-
10
-
11
-
12
-
13
-
14
-
15
-
16
-
17
-
18
-
19
-
20
-
21
-
22
-
23
-
24
-
25
-
26
-
27
-
28
-
29
-
30
-
31
-
32
-
33
-
34
-
35
-
36
-
37
-
38
-
39
-
40
-
41
-
42
-
43
-
44
-
45
-
46
-
47
-
48
-
49
-
50
-
51
-
52
-
53
-
54
-
55
-
56
-
57
-
58
-
59
-
60
-
61
-
62
-
63
-
64
-
65
-
66
-
67
-
68
-
69
-
70
-
71
-
72
-
73
-
74
-
75
-
76
-
77
-
78
-
79
-
80
-
81
-
82
-
83
-
84
-
85
-
86
-
87
-
88
-
89
-
90
-
 91
91 -
 92
92 -
 93
93 -
 94
94 -
 95
95 -
 96
96 -
 97
97 -
 98
98 -
 99
99 -
 100
100 -
 101
101 -
 102
102 -
 103
103 -
 104
104 -
 105
105 -
 106
106 -
 107
107 -
 108
108 -
 109
109 -
 110
110 -
 111
111 -
112
-
113
-
114
-
115
-
116
-
117
-
118
-
119
-
120
-
121
-
122
-
123
-
124
-
125
-
126
-
127
-
128
-
129
-
130
-
131
-
132
-
133
-
134
-
135
-
136
-
137
-
138
-
139
-
140
-
141
-
142
-
143
-
144
-
145
-
146
-
147
-
148
-
149
-
150
-
151
-
152
-
153
-
154
-
155
-
156
-
157
-
158
-
159
-
160
-
161
-
162
-
163
-
164
-
165
-
166
-
167
-
168
-
169
-
170
-
171
-
172
-
173
-
174
-
175
-
176
-
177
-
178
-
179
-
180
-
181
-
182
-
183
-
184
-
185
-
186
-
187
-
188
-
189
-
190
-
191
-
192
-
193
-
194
-
195
-
196
-
197
-
198
-
199
-
200
-
201
-
202
-
203
-
204
-
205
-
206
-
207
-
208
-
209
-
210
-
211
-
212
-
213
-
214
-
215
-
216
-
217
-
218
-
219
-
220
-
221
-
222
-
223
-
224
-
225
-
226
-
227
-
228
-
229
-
230
-
231
-
232
-
233
-
234
-
235
-
236
-
237
-
238
 |
 |

ITEM 7. MANAGEMENT’S DISCUSSION AND ANALYSIS OF FINANCIAL CONDITION AND
RESULTS OF OPERATIONS (Continued)
ADJUSTED PRE-TAX INCOME (LOSS)
Car Rental Segment
Adjusted pre-tax income for our car rental segment of $850.2 million increased 32.5% from
$641.9 million for 2010. The increase was primarily due to stronger volumes, improved residual values
and disciplined cost management, partly offset by decreased pricing. Adjustments to our car rental
segment income before income taxes for 2011 totaled $94.5 million (which consists of non-cash debt
charges of $43.9 million, purchase accounting of $39.5 million, restructuring and restructuring related
charges of $23.6 million, pension adjustment of $(13.1) million and loss on derivatives of $0.6 million).
Adjustments to our car rental segment income before income taxes for 2010 totaled $200.1 million
(which consists of non-cash debt charges of $133.3 million, purchase accounting of $37.0 million,
restructuring and restructuring related charges of $30.0 million and gain on derivatives of $(0.2) million).
See footnote (c) to the table under ‘‘Results of Operations’’ for a summary and description of these
adjustments.
Equipment Rental Segment
Adjusted pre-tax income for our equipment rental segment of $161.6 million increased 107.2% from
$78.0 million for 2010. The increase was primarily due to stronger volumes and pricing, strong cost
management performance and higher residual values on the disposal of used equipment. Adjustments
to our equipment rental segment income before income taxes for 2011 totaled $92.3 million (which
consists of purchase accounting of $44.4 million, restructuring and restructuring related charges of
$42.4 million and non-cash debt charges of $5.5 million). Adjustments to our equipment rental loss
before income taxes for 2010 totaled $92.6 million (which consists of purchase accounting of
$50.1 million, restructuring and restructuring related charges of $35.0 million and non-cash debt
charges of $7.5 million). See footnote (c) to the table under ‘‘Results of Operations’’ for a summary and
description of these adjustments.
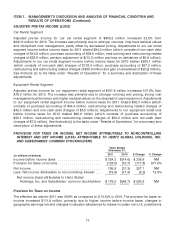
PROVISION FOR TAXES ON INCOME, NET INCOME ATTRIBUTABLE TO NONCONTROLLING
INTEREST AND NET INCOME (LOSS) ATTRIBUTABLE TO HERTZ GLOBAL HOLDINGS, INC.
AND SUBSIDIARIES’ COMMON STOCKHOLDERS
Years Ended
December 31,
2011 2010 $ Change % Change
(in millions of dollars)
Income before income taxes ...................... $324.3 $(14.6) $ 338.9 NM
Provision for taxes on income ...................... (128.5) (16.7) (111.8) 671.5%
Net income ................................... 195.8 (31.3) 227.1 NM
Less: Net income attributable to noncontrolling interest . . . (19.6) (17.4) (2.2) 12.5%
Net income (loss) attributable to Hertz Global
Holdings, Inc. and Subsidiaries’ common stockholders $ 176.2 $(48.7) $ 224.9 NM
Provision for Taxes on Income
The effective tax rate for 2011 was 39.6% as compared to (113.8)% in 2010. The provision for taxes on
income increased $111.8 million, primarily due to higher income before income taxes, changes in
geographic earnings mix and changes in valuation allowances for losses in certain non-U.S. jurisdictions
77