Hertz 2012 Annual Report Download - page 104
Download and view the complete annual report
Please find page 104 of the 2012 Hertz annual report below. You can navigate through the pages in the report by either clicking on the pages listed below, or by using the keyword search tool below to find specific information within the annual report.-
 1
1 -
2
-
3
-
4
-
5
-
6
-
7
-
8
-
9
-
10
-
11
-
12
-
13
-
14
-
15
-
16
-
17
-
18
-
19
-
20
-
21
-
22
-
23
-
24
-
25
-
26
-
27
-
28
-
29
-
30
-
31
-
32
-
33
-
34
-
35
-
36
-
37
-
38
-
39
-
40
-
41
-
42
-
43
-
44
-
45
-
46
-
47
-
48
-
49
-
50
-
51
-
52
-
53
-
54
-
55
-
56
-
57
-
58
-
59
-
60
-
61
-
62
-
63
-
64
-
65
-
66
-
67
-
68
-
69
-
70
-
71
-
72
-
73
-
74
-
75
-
76
-
77
-
78
-
79
-
80
-
81
-
82
-
83
-
84
-
85
-
86
-
87
-
88
-
89
-
90
-
91
-
92
-
93
-
 94
94 -
 95
95 -
 96
96 -
 97
97 -
 98
98 -
 99
99 -
 100
100 -
 101
101 -
 102
102 -
 103
103 -
 104
104 -
 105
105 -
 106
106 -
 107
107 -
 108
108 -
 109
109 -
 110
110 -
 111
111 -
 112
112 -
 113
113 -
 114
114 -
115
-
116
-
117
-
118
-
119
-
120
-
121
-
122
-
123
-
124
-
125
-
126
-
127
-
128
-
129
-
130
-
131
-
132
-
133
-
134
-
135
-
136
-
137
-
138
-
139
-
140
-
141
-
142
-
143
-
144
-
145
-
146
-
147
-
148
-
149
-
150
-
151
-
152
-
153
-
154
-
155
-
156
-
157
-
158
-
159
-
160
-
161
-
162
-
163
-
164
-
165
-
166
-
167
-
168
-
169
-
170
-
171
-
172
-
173
-
174
-
175
-
176
-
177
-
178
-
179
-
180
-
181
-
182
-
183
-
184
-
185
-
186
-
187
-
188
-
189
-
190
-
191
-
192
-
193
-
194
-
195
-
196
-
197
-
198
-
199
-
200
-
201
-
202
-
203
-
204
-
205
-
206
-
207
-
208
-
209
-
210
-
211
-
212
-
213
-
214
-
215
-
216
-
217
-
218
-
219
-
220
-
221
-
222
-
223
-
224
-
225
-
226
-
227
-
228
-
229
-
230
-
231
-
232
-
233
-
234
-
235
-
236
-
237
-
238
 |
 |

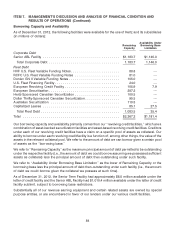
ITEM 7. MANAGEMENT’S DISCUSSION AND ANALYSIS OF FINANCIAL CONDITION AND
RESULTS OF OPERATIONS (Continued)
Years Ended December 31,
2012 2011 2010
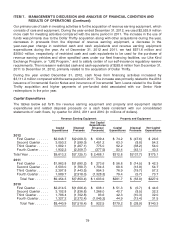
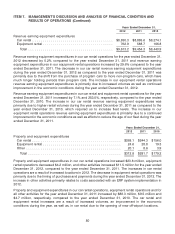
Revenue earning equipment expenditures
Car rental ........................................ $8,850.3 $8,865.6 $8,274.1
Equipment rental ................................... 762.9 588.7 166.8
Total .......................................... $9,613.2 $9,454.3 $8,440.9
Revenue earning equipment expenditures in our car rental operations for the year ended December 31,
2012 decreased by 0.2% compared to the year ended December 31, 2011 and revenue earning
equipment expenditures in our equipment rental operations increased by 29.6% compared to the year
ended December 31, 2011. The decrease in our car rental revenue earning equipment expenditures
during the year ended December 31, 2012 as compared to the year ended December 31, 2011 was
primarily due to the shift from the purchase of program cars to more non-program cars, which have
much longer holding periods than program cars. The increase in our equipment rental operations
revenue earning equipment expenditures is primarily due to increased volumes as well as continued
improvement in the economic conditions during the year ended December 31, 2012.
Revenue earning equipment expenditures in our car rental and equipment rental operations for the year
ended December 31, 2011 increased by 7.1% and 253.0%, respectively, compared to the year ended
December 31, 2010. The increase in our car rental revenue earning equipment expenditures was
primarily due to higher rental volumes during the year ended December 31, 2011 as compared to the
year ended December 31, 2010, which required us to increase fleet levels. The increase in our
equipment rental operations revenue earning equipment expenditures is primarily due to a continued
improvement in the economic conditions as well as efforts to reduce the age of our fleet during the year
ended December 31, 2011.
Years Ended December 31,
2012 2011 2010
Property and equipment expenditures
Car rental ............................................ $268.1 $244.3 $156.0
Equipment rental ....................................... 24.6 28.8 19.3
Other ............................................... 20.1 8.6 3.9
Total .............................................. $312.8 $281.7 $179.2
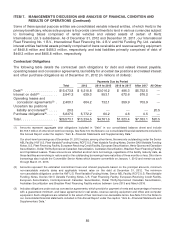
Property and equipment expenditures in our car rental operations increased $23.8 million, equipment
rental operations decreased $4.2 million, and other activities increased $11.5 million for the year ended
December 31, 2012, compared to the year ended December 31, 2011. The increases in car rental
operations are a result of increased locations in 2012. The decrease in equipment rental operations was
primarily due to the timing of purchases and payments during the year ended December 31, 2012. The
increase in other activities primarily relates to costs associated with an ERP system implementation in
2012.
Property and equipment expenditures in our car rental operations, equipment rental operations and for
all other activities for the year ended December 31, 2011 increased by $88.3 million, $9.5 million and
$4.7 million, respectively, compared to the year ended December 31, 2010. The car rental and
equipment rental increases are a result of increased volumes, an improvement in the economic
conditions during the year, as well as, in car rental due to the opening of new off-airport locations.
80