Hertz 2012 Annual Report Download - page 111
Download and view the complete annual report
Please find page 111 of the 2012 Hertz annual report below. You can navigate through the pages in the report by either clicking on the pages listed below, or by using the keyword search tool below to find specific information within the annual report.-
 1
1 -
2
-
3
-
4
-
5
-
6
-
7
-
8
-
9
-
10
-
11
-
12
-
13
-
14
-
15
-
16
-
17
-
18
-
19
-
20
-
21
-
22
-
23
-
24
-
25
-
26
-
27
-
28
-
29
-
30
-
31
-
32
-
33
-
34
-
35
-
36
-
37
-
38
-
39
-
40
-
41
-
42
-
43
-
44
-
45
-
46
-
47
-
48
-
49
-
50
-
51
-
52
-
53
-
54
-
55
-
56
-
57
-
58
-
59
-
60
-
61
-
62
-
63
-
64
-
65
-
66
-
67
-
68
-
69
-
70
-
71
-
72
-
73
-
74
-
75
-
76
-
77
-
78
-
79
-
80
-
81
-
82
-
83
-
84
-
85
-
86
-
87
-
88
-
89
-
90
-
91
-
92
-
93
-
94
-
95
-
96
-
97
-
98
-
99
-
100
-
 101
101 -
 102
102 -
 103
103 -
 104
104 -
 105
105 -
 106
106 -
 107
107 -
 108
108 -
 109
109 -
 110
110 -
 111
111 -
 112
112 -
 113
113 -
 114
114 -
 115
115 -
 116
116 -
 117
117 -
 118
118 -
 119
119 -
 120
120 -
 121
121 -
122
-
123
-
124
-
125
-
126
-
127
-
128
-
129
-
130
-
131
-
132
-
133
-
134
-
135
-
136
-
137
-
138
-
139
-
140
-
141
-
142
-
143
-
144
-
145
-
146
-
147
-
148
-
149
-
150
-
151
-
152
-
153
-
154
-
155
-
156
-
157
-
158
-
159
-
160
-
161
-
162
-
163
-
164
-
165
-
166
-
167
-
168
-
169
-
170
-
171
-
172
-
173
-
174
-
175
-
176
-
177
-
178
-
179
-
180
-
181
-
182
-
183
-
184
-
185
-
186
-
187
-
188
-
189
-
190
-
191
-
192
-
193
-
194
-
195
-
196
-
197
-
198
-
199
-
200
-
201
-
202
-
203
-
204
-
205
-
206
-
207
-
208
-
209
-
210
-
211
-
212
-
213
-
214
-
215
-
216
-
217
-
218
-
219
-
220
-
221
-
222
-
223
-
224
-
225
-
226
-
227
-
228
-
229
-
230
-
231
-
232
-
233
-
234
-
235
-
236
-
237
-
238
 |
 |
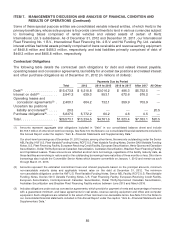
ITEM 7. MANAGEMENT’S DISCUSSION AND ANALYSIS OF FINANCIAL CONDITION AND
RESULTS OF OPERATIONS (Continued)
Environmental
We have indemnified various parties for the costs associated with remediating numerous hazardous
substance storage, recycling or disposal sites in many states and, in some instances, for natural
resource damages. The amount of any such expenses or related natural resource damages for which we
may be held responsible could be substantial. The probable expenses that we expect to incur for such
matters have been accrued, and those expenses are reflected in our consolidated financial statements.
As of December 31, 2012 and 2011, the aggregate amounts accrued for environmental liabilities
including liability for environmental indemnities, reflected in our condensed consolidated balance
sheets in ‘‘Other accrued liabilities’’ were $2.6 million and $1.5 million, respectively. The accrual
generally represents the estimated cost to study potential environmental issues at sites deemed to
require investigation or clean-up activities, and the estimated cost to implement remediation actions,
including on-going maintenance, as required. Cost estimates are developed by site. Initial cost
estimates are based on historical experience at similar sites and are refined over time on the basis of
in-depth studies of the sites. For many sites, the remediation costs and other damages for which we
ultimately may be responsible cannot be reasonably estimated because of uncertainties with respect to
factors such as our connection to the site, the materials there, the involvement of other potentially
responsible parties, the application of laws and other standards or regulations, site conditions, and the
nature and scope of investigations, studies, and remediation to be undertaken (including the
technologies to be required and the extent, duration, and success of remediation).
Risk Management
For a discussion of additional risks arising from our operations, including vehicle liability, general liability
and property damage insurable risks, see ‘‘Item 1—Business—Risk Management’’ in this Annual
Report.
Market Risks
We are exposed to a variety of market risks, including the effects of changes in interest rates (including
credit spreads), foreign currency exchange rates and fluctuations in fuel prices. We manage our
exposure to these market risks through our regular operating and financing activities and, when deemed
appropriate, through the use of derivative financial instruments. Derivative financial instruments are
viewed as risk management tools and have not been used for speculative or trading purposes. In
addition, derivative financial instruments are entered into with a diversified group of major financial
institutions in order to manage our exposure to counterparty nonperformance on such instruments. For
more information on these exposures, see Note 14 to the Notes to our consolidated financial statements
included in this Annual Report under the caption ‘‘Item 8—Financial Statements and Supplementary
Data.’’
Interest Rate Risk
From time to time, we may enter into interest rate swap agreements and/or interest rate cap agreements
to manage interest rate risk. See Notes 4 and 13 to the Notes to our audited annual consolidated
financial statements included in this Annual Report under the caption ‘‘Item 8—Financial Statements and
Supplementary Data.’’
We have a significant amount of debt with variable rates of interest based generally on LIBOR, Euro
inter-bank offered rate, or ‘‘EURIBOR,’’ or their equivalents for local currencies or bank conduit
commercial paper rates plus an applicable margin. Increases in interest rates could therefore
87