Hertz 2012 Annual Report Download - page 170
Download and view the complete annual report
Please find page 170 of the 2012 Hertz annual report below. You can navigate through the pages in the report by either clicking on the pages listed below, or by using the keyword search tool below to find specific information within the annual report.-
 1
1 -
2
-
3
-
4
-
5
-
6
-
7
-
8
-
9
-
10
-
11
-
12
-
13
-
14
-
15
-
16
-
17
-
18
-
19
-
20
-
21
-
22
-
23
-
24
-
25
-
26
-
27
-
28
-
29
-
30
-
31
-
32
-
33
-
34
-
35
-
36
-
37
-
38
-
39
-
40
-
41
-
42
-
43
-
44
-
45
-
46
-
47
-
48
-
49
-
50
-
51
-
52
-
53
-
54
-
55
-
56
-
57
-
58
-
59
-
60
-
61
-
62
-
63
-
64
-
65
-
66
-
67
-
68
-
69
-
70
-
71
-
72
-
73
-
74
-
75
-
76
-
77
-
78
-
79
-
80
-
81
-
82
-
83
-
84
-
85
-
86
-
87
-
88
-
89
-
90
-
91
-
92
-
93
-
94
-
95
-
96
-
97
-
98
-
99
-
100
-
101
-
102
-
103
-
104
-
105
-
106
-
107
-
108
-
109
-
110
-
111
-
112
-
113
-
114
-
115
-
116
-
117
-
118
-
119
-
120
-
121
-
122
-
123
-
124
-
125
-
126
-
127
-
128
-
129
-
130
-
131
-
132
-
133
-
134
-
135
-
136
-
137
-
138
-
139
-
140
-
141
-
142
-
143
-
144
-
145
-
146
-
147
-
148
-
149
-
150
-
151
-
152
-
153
-
154
-
155
-
156
-
157
-
158
-
159
-
 160
160 -
 161
161 -
 162
162 -
 163
163 -
 164
164 -
 165
165 -
 166
166 -
 167
167 -
 168
168 -
 169
169 -
 170
170 -
 171
171 -
 172
172 -
 173
173 -
 174
174 -
 175
175 -
 176
176 -
 177
177 -
 178
178 -
 179
179 -
 180
180 -
181
-
182
-
183
-
184
-
185
-
186
-
187
-
188
-
189
-
190
-
191
-
192
-
193
-
194
-
195
-
196
-
197
-
198
-
199
-
200
-
201
-
202
-
203
-
204
-
205
-
206
-
207
-
208
-
209
-
210
-
211
-
212
-
213
-
214
-
215
-
216
-
217
-
218
-
219
-
220
-
221
-
222
-
223
-
224
-
225
-
226
-
227
-
228
-
229
-
230
-
231
-
232
-
233
-
234
-
235
-
236
-
237
-
238
 |
 |

HERTZ GLOBAL HOLDINGS, INC. AND SUBSIDIARIES
NOTES TO CONSOLIDATED FINANCIAL STATEMENTS (Continued)
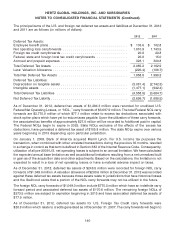
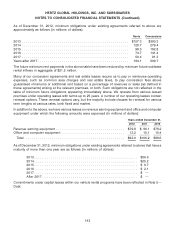
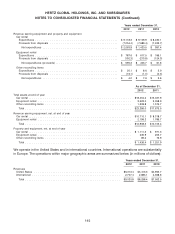
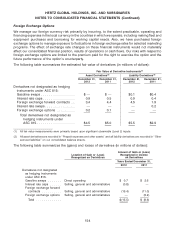
As of December 31,
2012 2011
Total assets at end of year
United States ..................................................... $18,136.7 $12,730.6
International ...................................................... 5,149.3 4,942.9
Total .......................................................... $23,286.0 $17,673.5
Revenue earning equipment, net, at end of year
United States ..................................................... $10,221.3 $ 7,621.2
International ...................................................... 2,687.0 2,484.2
Total .......................................................... $12,908.3 $10,105.4
Property and equipment, net, at end of year
United States ..................................................... $ 1,226.1 $ 1,036.7
International ...................................................... 210.3 215.2
Total .......................................................... $1,436.4 $ 1,251.9
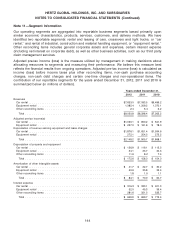
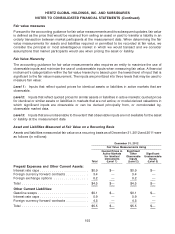
(a) The following table reconciles adjusted pre-tax income to income (loss) before income taxes for the years ended
December 31, 2012, 2011 and 2010 (in millions of dollars):
Years Ended December 31,
2012 2011 2010
Adjusted pre-tax income:
Car rental ......................................... $1,020.1 $ 850.2 $ 641.9
Equipment rental .................................... 227.0 161.6 78.0
Total reportable segments ............................. 1,247.1 1,011.8 719.9
Adjustments:
Other reconciling items(1) ............................... (345.6) (331.3) (372.8)
Purchase accounting(2) ................................ (109.6) (87.6) (90.3)
Non-cash debt charges(3) ............................... (83.6) (130.4) (182.6)
Restructuring charges ................................. (38.0) (56.4) (54.7)
Restructuring related charges(4) ........................... (11.1) (9.8) (13.2)
Derivative gains (losses)(5) .............................. (0.9) 0.1 (3.2)
Acquisition related costs and charges(6) ...................... (163.7) (18.8) (17.7)
Management transition costs ............................ — (4.0) —
Pension adjustment(7) ................................. — 13.1 —
Premiums paid on debt(8) ............................... — (62.4) —
Other(9) .......................................... (44.0) — —
Income (loss) before income taxes ....................... $ 450.5 $ 324.3 $ (14.6)
(1) Represents general corporate expenses, certain interest expense (including net interest on corporate debt), as well
as other business activities.
(2) Represents the increase in amortization of other intangible assets, depreciation of property and equipment and
accretion of revalued liabilities relating to purchase accounting.
(3) Represents non-cash debt charges relating to the amortization and write-off of deferred debt financing costs and
debt discounts.
(4) Represents incremental costs incurred directly supporting our business transformation initiatives. Such costs
include transition costs incurred in connection with our business process outsourcing arrangements and
incremental costs incurred to facilitate business process re-engineering initiatives that involve significant
organization redesign and extensive operational process changes.
(5) Represents the mark-to-market adjustment on our interest rate cap.
(6) Primarily represents Dollar Thrifty acquisition related expenses, change in control expenses, ‘Day-1’ compensation
expenses and other adjustments related to the Dollar Thrifty acquisition, loss on the Advantage divestiture,
expenses related to additional required divestitures and costs associated with the Dollar Thrifty acquisition,
146