Hertz 2012 Annual Report Download - page 165
Download and view the complete annual report
Please find page 165 of the 2012 Hertz annual report below. You can navigate through the pages in the report by either clicking on the pages listed below, or by using the keyword search tool below to find specific information within the annual report.-
 1
1 -
2
-
3
-
4
-
5
-
6
-
7
-
8
-
9
-
10
-
11
-
12
-
13
-
14
-
15
-
16
-
17
-
18
-
19
-
20
-
21
-
22
-
23
-
24
-
25
-
26
-
27
-
28
-
29
-
30
-
31
-
32
-
33
-
34
-
35
-
36
-
37
-
38
-
39
-
40
-
41
-
42
-
43
-
44
-
45
-
46
-
47
-
48
-
49
-
50
-
51
-
52
-
53
-
54
-
55
-
56
-
57
-
58
-
59
-
60
-
61
-
62
-
63
-
64
-
65
-
66
-
67
-
68
-
69
-
70
-
71
-
72
-
73
-
74
-
75
-
76
-
77
-
78
-
79
-
80
-
81
-
82
-
83
-
84
-
85
-
86
-
87
-
88
-
89
-
90
-
91
-
92
-
93
-
94
-
95
-
96
-
97
-
98
-
99
-
100
-
101
-
102
-
103
-
104
-
105
-
106
-
107
-
108
-
109
-
110
-
111
-
112
-
113
-
114
-
115
-
116
-
117
-
118
-
119
-
120
-
121
-
122
-
123
-
124
-
125
-
126
-
127
-
128
-
129
-
130
-
131
-
132
-
133
-
134
-
135
-
136
-
137
-
138
-
139
-
140
-
141
-
142
-
143
-
144
-
145
-
146
-
147
-
148
-
149
-
150
-
151
-
152
-
153
-
154
-
 155
155 -
 156
156 -
 157
157 -
 158
158 -
 159
159 -
 160
160 -
 161
161 -
 162
162 -
 163
163 -
 164
164 -
 165
165 -
 166
166 -
 167
167 -
 168
168 -
 169
169 -
 170
170 -
 171
171 -
 172
172 -
 173
173 -
 174
174 -
 175
175 -
176
-
177
-
178
-
179
-
180
-
181
-
182
-
183
-
184
-
185
-
186
-
187
-
188
-
189
-
190
-
191
-
192
-
193
-
194
-
195
-
196
-
197
-
198
-
199
-
200
-
201
-
202
-
203
-
204
-
205
-
206
-
207
-
208
-
209
-
210
-
211
-
212
-
213
-
214
-
215
-
216
-
217
-
218
-
219
-
220
-
221
-
222
-
223
-
224
-
225
-
226
-
227
-
228
-
229
-
230
-
231
-
232
-
233
-
234
-
235
-
236
-
237
-
238
 |
 |

HERTZ GLOBAL HOLDINGS, INC. AND SUBSIDIARIES
NOTES TO CONSOLIDATED FINANCIAL STATEMENTS (Continued)
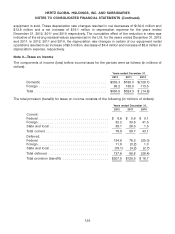
expire in 2015. A valuation allowance of $13.5 million at December 31, 2012 was recorded against a
portion of the U.S. foreign tax credit deferred tax assets in the likelihood that they may not be utilized in
the future. A deferred tax asset was also recorded for various state tax credit carry forwards of
$3.0 million, which will begin to expire in 2027.
In determining the valuation allowance, an assessment of positive and negative evidence was performed
regarding realization of the net deferred tax assets in accordance with ASC 740-10, ‘‘Accounting for
Income Taxes,’’ or ‘‘ASC 740-10.’’ This assessment included the evaluation of scheduled reversals of
deferred tax liabilities, the availability of carry forwards and estimates of projected future taxable income.
Based on the assessment, as of December 31, 2012, total valuation allowances of $226.4 million were
recorded against deferred tax assets. Although realization is not assured, we have concluded that it is
more likely than not the remaining deferred tax assets of $1,858.8 million will be realized and as such no
valuation allowance has been provided on these assets.
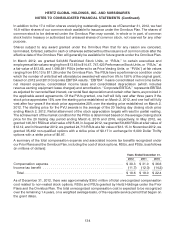
The significant items in the reconciliation of the statutory and effective income tax rates consisted of the
following:
Years ended December 31,
2012 2011 2010
Statutory Federal Tax Rate ................................ 35.0% 35.0% 35.0%
Foreign tax differential ................................... (3.5) (3.8) 70.9
State and local income taxes, net of federal income tax benefit ..... 3.1 3.9 13.1
Change in state statutory rates, net of federal income tax benefit .... (1.1) 0.7 (11.2)
Federal and foreign permanent differences .................... 2.5 (1.4) 52.9
Withholding taxes ...................................... 1.9 2.3 (58.0)
Uncertain tax positions .................................. (0.7) (1.0) (24.8)
Change in valuation allowance ............................. 8.8 0.7 (187.7)
All other items, net ..................................... — 3.2 (4.0)
Effective Tax Rate ...................................... 46.0% 39.6% (113.8)%
The effective tax rate for the year ended December 31, 2012 was 46.0% as compared to 39.6% in the
year ended December 31, 2011. The provision for taxes on income increased $79.0 million, primarily due
to higher income before income taxes, changes in geographic earnings mix, changes in valuation
allowances for losses in certain non-U.S. jurisdictions for which tax benefits cannot be realized and
non-deductible compensation payments under Internal Revenue Code Section 280(G) related to the
Dollar Thrifty acquisition.
The negative effective tax rate in 2010 is primarily due to a lower loss before income taxes in 2010,
valuation allowances for losses in certain non-U.S. jurisdictions for which tax benefits cannot be realized
and differences in foreign tax rates versus the U.S. Federal tax rate and the impact of the France law
change in 2010.
As of December 31, 2012, our foreign subsidiaries have $270.3 million of undistributed earnings which
would be subject to taxation if repatriated. Deferred tax liabilities have not been recorded for such
earnings because it is management’s current intention to permanently reinvest undistributed earnings
offshore. It is not practicable to estimate the amount of such deferred tax liabilities. If, in the future,
undistributed earnings are repatriated to the United States, or it is determined such earnings will be
repatriated in the foreseeable future, deferred tax liabilities will be recorded.
141