Hertz 2012 Annual Report Download - page 168
Download and view the complete annual report
Please find page 168 of the 2012 Hertz annual report below. You can navigate through the pages in the report by either clicking on the pages listed below, or by using the keyword search tool below to find specific information within the annual report.-
 1
1 -
2
-
3
-
4
-
5
-
6
-
7
-
8
-
9
-
10
-
11
-
12
-
13
-
14
-
15
-
16
-
17
-
18
-
19
-
20
-
21
-
22
-
23
-
24
-
25
-
26
-
27
-
28
-
29
-
30
-
31
-
32
-
33
-
34
-
35
-
36
-
37
-
38
-
39
-
40
-
41
-
42
-
43
-
44
-
45
-
46
-
47
-
48
-
49
-
50
-
51
-
52
-
53
-
54
-
55
-
56
-
57
-
58
-
59
-
60
-
61
-
62
-
63
-
64
-
65
-
66
-
67
-
68
-
69
-
70
-
71
-
72
-
73
-
74
-
75
-
76
-
77
-
78
-
79
-
80
-
81
-
82
-
83
-
84
-
85
-
86
-
87
-
88
-
89
-
90
-
91
-
92
-
93
-
94
-
95
-
96
-
97
-
98
-
99
-
100
-
101
-
102
-
103
-
104
-
105
-
106
-
107
-
108
-
109
-
110
-
111
-
112
-
113
-
114
-
115
-
116
-
117
-
118
-
119
-
120
-
121
-
122
-
123
-
124
-
125
-
126
-
127
-
128
-
129
-
130
-
131
-
132
-
133
-
134
-
135
-
136
-
137
-
138
-
139
-
140
-
141
-
142
-
143
-
144
-
145
-
146
-
147
-
148
-
149
-
150
-
151
-
152
-
153
-
154
-
155
-
156
-
157
-
 158
158 -
 159
159 -
 160
160 -
 161
161 -
 162
162 -
 163
163 -
 164
164 -
 165
165 -
 166
166 -
 167
167 -
 168
168 -
 169
169 -
 170
170 -
 171
171 -
 172
172 -
 173
173 -
 174
174 -
 175
175 -
 176
176 -
 177
177 -
 178
178 -
179
-
180
-
181
-
182
-
183
-
184
-
185
-
186
-
187
-
188
-
189
-
190
-
191
-
192
-
193
-
194
-
195
-
196
-
197
-
198
-
199
-
200
-
201
-
202
-
203
-
204
-
205
-
206
-
207
-
208
-
209
-
210
-
211
-
212
-
213
-
214
-
215
-
216
-
217
-
218
-
219
-
220
-
221
-
222
-
223
-
224
-
225
-
226
-
227
-
228
-
229
-
230
-
231
-
232
-
233
-
234
-
235
-
236
-
237
-
238
 |
 |

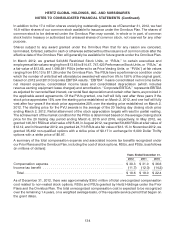
HERTZ GLOBAL HOLDINGS, INC. AND SUBSIDIARIES
NOTES TO CONSOLIDATED FINANCIAL STATEMENTS (Continued)
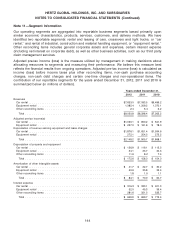
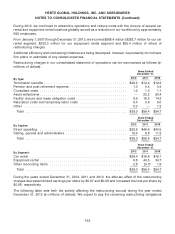
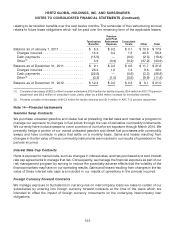
Note 11—Segment Information
Our operating segments are aggregated into reportable business segments based primarily upon
similar economic characteristics, products, services, customers, and delivery methods. We have
identified two reportable segments: rental and leasing of cars, crossovers and light trucks, or ‘‘car
rental,’’ and rental of industrial, construction and material handling equipment, or ‘‘equipment rental.’’
Other reconciling items includes general corporate assets and expenses, certain interest expense
(including net interest on corporate debt), as well as other business activities, such as our third party
claim management services.
Adjusted pre-tax income (loss) is the measure utilized by management in making decisions about
allocating resources to segments and measuring their performance. We believe this measure best
reflects the financial results from ongoing operations. Adjusted pre-tax income (loss) is calculated as
income (loss) before income taxes plus other reconciling items, non-cash purchase accounting
charges, non-cash debt charges and certain one-time charges and non-operational items. The
contribution of our reportable segments for the years ended December 31, 2012, 2011 and 2010 is
summarized below (in millions of dollars).
Years ended December 31,
2012 2011 2010
Revenues
Car rental .................................................. $7,633.0 $7,083.5 $6,486.2
Equipment rental ............................................. 1,385.4 1,209.5 1,070.1
Other reconciling items ......................................... 2.4 5.4 6.2
Total .................................................... $9,020.8 $8,298.4 $7,562.5
Adjusted pre-tax income(a)
Car rental .................................................. $1,020.1 $ 850.2 $ 641.9
Equipment rental ............................................. $ 227.0 $ 161.6 $ 78.0
Depreciation of revenue earning equipment and lease charges
Car rental .................................................. $1,876.1 $1,651.4 $1,594.6
Equipment rental ............................................. 272.1 254.3 273.5
Total .................................................... $2,148.2 $1,905.7 $1,868.1
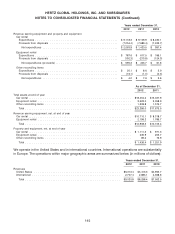
Depreciation of property and equipment
Car rental .................................................. $ 126.9 $ 116.1 $ 112.3
Equipment rental ............................................. 34.1 33.7 34.3
Other reconciling items ......................................... 11.6 8.2 7.4
Total .................................................... $ 172.6 $ 158.0 $ 154.0
Amortization of other intangible assets
Car rental .................................................. $ 41.7 $ 32.7 $ 30.2
Equipment rental ............................................. 40.6 35.8 33.4
Other reconciling items ......................................... 1.8 1.5 1.1
Total .................................................... $ 84.1 $ 70.0 $ 64.7
Interest expense
Car rental .................................................. $ 316.3 $ 333.1 $ 401.3
Equipment rental ............................................. 52.0 45.3 39.4
Other reconciling items ......................................... 281.6 321.3 332.7
Total .................................................... $ 649.9 $ 699.7 $ 773.4
144