Hertz 2012 Annual Report Download - page 30
Download and view the complete annual report
Please find page 30 of the 2012 Hertz annual report below. You can navigate through the pages in the report by either clicking on the pages listed below, or by using the keyword search tool below to find specific information within the annual report.-
 1
1 -
2
-
3
-
4
-
5
-
6
-
7
-
8
-
9
-
10
-
11
-
12
-
13
-
14
-
15
-
16
-
17
-
18
-
19
-
 20
20 -
 21
21 -
 22
22 -
 23
23 -
 24
24 -
 25
25 -
 26
26 -
 27
27 -
 28
28 -
 29
29 -
 30
30 -
 31
31 -
 32
32 -
 33
33 -
 34
34 -
 35
35 -
 36
36 -
 37
37 -
 38
38 -
 39
39 -
 40
40 -
41
-
42
-
43
-
44
-
45
-
46
-
47
-
48
-
49
-
50
-
51
-
52
-
53
-
54
-
55
-
56
-
57
-
58
-
59
-
60
-
61
-
62
-
63
-
64
-
65
-
66
-
67
-
68
-
69
-
70
-
71
-
72
-
73
-
74
-
75
-
76
-
77
-
78
-
79
-
80
-
81
-
82
-
83
-
84
-
85
-
86
-
87
-
88
-
89
-
90
-
91
-
92
-
93
-
94
-
95
-
96
-
97
-
98
-
99
-
100
-
101
-
102
-
103
-
104
-
105
-
106
-
107
-
108
-
109
-
110
-
111
-
112
-
113
-
114
-
115
-
116
-
117
-
118
-
119
-
120
-
121
-
122
-
123
-
124
-
125
-
126
-
127
-
128
-
129
-
130
-
131
-
132
-
133
-
134
-
135
-
136
-
137
-
138
-
139
-
140
-
141
-
142
-
143
-
144
-
145
-
146
-
147
-
148
-
149
-
150
-
151
-
152
-
153
-
154
-
155
-
156
-
157
-
158
-
159
-
160
-
161
-
162
-
163
-
164
-
165
-
166
-
167
-
168
-
169
-
170
-
171
-
172
-
173
-
174
-
175
-
176
-
177
-
178
-
179
-
180
-
181
-
182
-
183
-
184
-
185
-
186
-
187
-
188
-
189
-
190
-
191
-
192
-
193
-
194
-
195
-
196
-
197
-
198
-
199
-
200
-
201
-
202
-
203
-
204
-
205
-
206
-
207
-
208
-
209
-
210
-
211
-
212
-
213
-
214
-
215
-
216
-
217
-
218
-
219
-
220
-
221
-
222
-
223
-
224
-
225
-
226
-
227
-
228
-
229
-
230
-
231
-
232
-
233
-
234
-
235
-
236
-
237
-
238
 |
 |

22MAR201316253565 22MAR201316203800
22MAR201316253303
ITEM 1. BUSINESS (Continued)
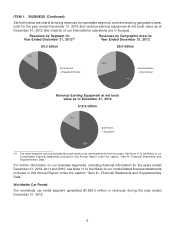
Set forth below are charts showing revenues by reportable segment, and revenues by geographic area,
both for the year ended December 31, 2012 and revenue earning equipment at net book value as of
December 31, 2012 (the majority of our international operations are in Europe).
Revenues by Segment for Revenues by Geographic Area for
Year Ended December 31, 2012(1) Year Ended December 31, 2012
$9.0 billion $9.0 billion
15%
85%
Car Rental
Equipment Rental
30%
70%
United States
International
Revenue Earning Equipment at net book
value as of December 31, 2012
$12.9 billion
17%
83%
Vechicles
Equipment
(1) Car rental segment revenue includes fees and certain cost reimbursements from licensees. See Note 11 to the Notes to our
consolidated financial statements included in this Annual Report under the caption ‘‘Item 8—Financial Statements and
Supplementary Data.’’
For further information on our business segments, including financial information for the years ended
December 31, 2012, 2011 and 2010, see Note 11 to the Notes to our consolidated financial statements
included in this Annual Report under the caption ‘‘Item 8—Financial Statements and Supplementary
Data.’’
Worldwide Car Rental
Our worldwide car rental segment generated $7,633.0 million in revenues during the year ended
December 31, 2012.
6