Hertz 2012 Annual Report Download - page 97
Download and view the complete annual report
Please find page 97 of the 2012 Hertz annual report below. You can navigate through the pages in the report by either clicking on the pages listed below, or by using the keyword search tool below to find specific information within the annual report.-
 1
1 -
2
-
3
-
4
-
5
-
6
-
7
-
8
-
9
-
10
-
11
-
12
-
13
-
14
-
15
-
16
-
17
-
18
-
19
-
20
-
21
-
22
-
23
-
24
-
25
-
26
-
27
-
28
-
29
-
30
-
31
-
32
-
33
-
34
-
35
-
36
-
37
-
38
-
39
-
40
-
41
-
42
-
43
-
44
-
45
-
46
-
47
-
48
-
49
-
50
-
51
-
52
-
53
-
54
-
55
-
56
-
57
-
58
-
59
-
60
-
61
-
62
-
63
-
64
-
65
-
66
-
67
-
68
-
69
-
70
-
71
-
72
-
73
-
74
-
75
-
76
-
77
-
78
-
79
-
80
-
81
-
82
-
83
-
84
-
85
-
86
-
 87
87 -
 88
88 -
 89
89 -
 90
90 -
 91
91 -
 92
92 -
 93
93 -
 94
94 -
 95
95 -
 96
96 -
 97
97 -
 98
98 -
 99
99 -
 100
100 -
 101
101 -
 102
102 -
 103
103 -
 104
104 -
 105
105 -
 106
106 -
 107
107 -
108
-
109
-
110
-
111
-
112
-
113
-
114
-
115
-
116
-
117
-
118
-
119
-
120
-
121
-
122
-
123
-
124
-
125
-
126
-
127
-
128
-
129
-
130
-
131
-
132
-
133
-
134
-
135
-
136
-
137
-
138
-
139
-
140
-
141
-
142
-
143
-
144
-
145
-
146
-
147
-
148
-
149
-
150
-
151
-
152
-
153
-
154
-
155
-
156
-
157
-
158
-
159
-
160
-
161
-
162
-
163
-
164
-
165
-
166
-
167
-
168
-
169
-
170
-
171
-
172
-
173
-
174
-
175
-
176
-
177
-
178
-
179
-
180
-
181
-
182
-
183
-
184
-
185
-
186
-
187
-
188
-
189
-
190
-
191
-
192
-
193
-
194
-
195
-
196
-
197
-
198
-
199
-
200
-
201
-
202
-
203
-
204
-
205
-
206
-
207
-
208
-
209
-
210
-
211
-
212
-
213
-
214
-
215
-
216
-
217
-
218
-
219
-
220
-
221
-
222
-
223
-
224
-
225
-
226
-
227
-
228
-
229
-
230
-
231
-
232
-
233
-
234
-
235
-
236
-
237
-
238
 |
 |

ITEM 7. MANAGEMENT’S DISCUSSION AND ANALYSIS OF FINANCIAL CONDITION AND
RESULTS OF OPERATIONS (Continued)
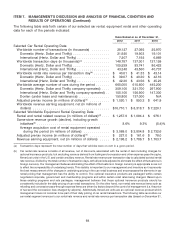
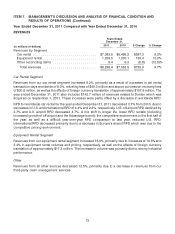
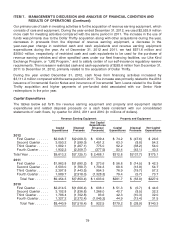
Year Ended December 31, 2011 Compared with Year Ended December 31, 2010
REVENUES
Years Ended
December 31,
2011 2010 $ Change % Change
(in millions of dollars)
Revenues by Segment
Car rental ................................ $7,083.5 $6,486.2 $597.3 9.2%
Equipment rental ........................... 1,209.5 1,070.1 139.4 13.0%
Other reconciling items ...................... 5.4 6.2 (0.8) (12.5)%
Total revenues ........................... $8,298.4 $7,562.5 $735.9 9.7%
Car Rental Segment
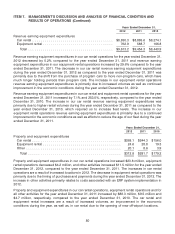
Revenues from our car rental segment increased 9.2%, primarily as a result of increases in car rental
transaction days worldwide of 8.0%, refueling fees of $40.3 million and airport concession recovery fees
of $30.8 million, as well as the effects of foreign currency translation of approximately $157.9 million. The
year ended December 31, 2011 also includes $142.7 million of revenues related to Donlen which was
acquired on September 1, 2011. These increases were partly offset by a decrease in worldwide RPD.
RPD for worldwide car rental for the year ended December 31, 2011 decreased 3.7% from 2010, due to
decreases in U.S. and International RPD of 4.4% and 2.3%, respectively. U.S. off-airport RPD declined by
2.7% and U.S. airport RPD decreased 4.7%. A mix shift to longer life, lower RPD rentals (including
increased growth of off-airport and the Advantage brand); the competitive environment in the first half of
the year, as well as a difficult year-over-year RPD comparison to last year, reduced U.S. RPD.
International RPD decreased primarily due to a decrease in Europe’s airport RPD which was due to the
competitive pricing environment.
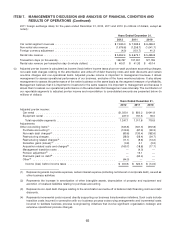
Equipment Rental Segment
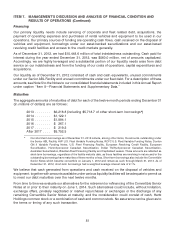
Revenues from our equipment rental segment increased 13.0%, primarily due to increases of 10.5% and
2.4% in equipment rental volumes and pricing, respectively, as well as the effects of foreign currency
translation of approximately $17.3 million. The increase in volume was primarily due to strong industrial
performance.
Other
Revenues from all other sources decreased 12.5%, primarily due to a decrease in revenues from our
third-party claim management services.
73