Hertz 2012 Annual Report Download - page 231
Download and view the complete annual report
Please find page 231 of the 2012 Hertz annual report below. You can navigate through the pages in the report by either clicking on the pages listed below, or by using the keyword search tool below to find specific information within the annual report.-
 1
1 -
2
-
3
-
4
-
5
-
6
-
7
-
8
-
9
-
10
-
11
-
12
-
13
-
14
-
15
-
16
-
17
-
18
-
19
-
20
-
21
-
22
-
23
-
24
-
25
-
26
-
27
-
28
-
29
-
30
-
31
-
32
-
33
-
34
-
35
-
36
-
37
-
38
-
39
-
40
-
41
-
42
-
43
-
44
-
45
-
46
-
47
-
48
-
49
-
50
-
51
-
52
-
53
-
54
-
55
-
56
-
57
-
58
-
59
-
60
-
61
-
62
-
63
-
64
-
65
-
66
-
67
-
68
-
69
-
70
-
71
-
72
-
73
-
74
-
75
-
76
-
77
-
78
-
79
-
80
-
81
-
82
-
83
-
84
-
85
-
86
-
87
-
88
-
89
-
90
-
91
-
92
-
93
-
94
-
95
-
96
-
97
-
98
-
99
-
100
-
101
-
102
-
103
-
104
-
105
-
106
-
107
-
108
-
109
-
110
-
111
-
112
-
113
-
114
-
115
-
116
-
117
-
118
-
119
-
120
-
121
-
122
-
123
-
124
-
125
-
126
-
127
-
128
-
129
-
130
-
131
-
132
-
133
-
134
-
135
-
136
-
137
-
138
-
139
-
140
-
141
-
142
-
143
-
144
-
145
-
146
-
147
-
148
-
149
-
150
-
151
-
152
-
153
-
154
-
155
-
156
-
157
-
158
-
159
-
160
-
161
-
162
-
163
-
164
-
165
-
166
-
167
-
168
-
169
-
170
-
171
-
172
-
173
-
174
-
175
-
176
-
177
-
178
-
179
-
180
-
181
-
182
-
183
-
184
-
185
-
186
-
187
-
188
-
189
-
190
-
191
-
192
-
193
-
194
-
195
-
196
-
197
-
198
-
199
-
200
-
201
-
202
-
203
-
204
-
205
-
206
-
207
-
208
-
209
-
210
-
211
-
212
-
213
-
214
-
215
-
216
-
217
-
218
-
219
-
220
-
 221
221 -
 222
222 -
 223
223 -
 224
224 -
 225
225 -
 226
226 -
 227
227 -
 228
228 -
 229
229 -
 230
230 -
 231
231 -
 232
232 -
 233
233 -
 234
234 -
 235
235 -
 236
236 -
 237
237 -
 238
238
 |
 |

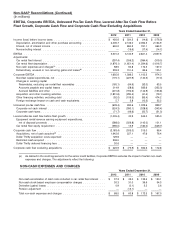
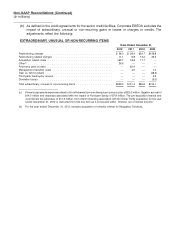
Non-GAAP Reconciliations (Continued)
(In millions, except per share amounts)
Adjusted Pre-Tax Income (Loss), Adjusted Net Income (Loss) and Adjusted Diluted Earnings Per
Share
Year Ended December 31, 2010
Other
Car Equipment Reconciling
Rental Rental Items Total
Income (loss) before income taxes .......................... $ 441.8 $ (14.6) $(441.8) $ (14.6)
Adjustments:
Purchase accounting(a) ................................ 37.0 50.1 3.2 90.3
Non-cash debt charges(b) ............................... 133.3 7.5 41.8 182.6
Restructuring charges(c) ................................ 18.1 34.7 1.9 54.7
Restructuring related charges(c) ........................... 11.9 0.3 1.0 13.2
Derivative (gains) losses(c) .............................. (0.2) — 3.4 3.2
Acquisition related costs(d) .............................. — — 17.7 17.7
Adjusted pre-tax income (loss) ............................. 641.9 78.0 (372.8) 347.1
Assumed (provision) benefit for income taxes of 34% ............... (218.3) (26.5) 126.8 (118.0)
Noncontrolling interest .................................. — — (17.4) (17.4)
Adjusted net income (loss) ............................... $ 423.6 $ 51.5 $(263.4) $ 211.7
Adjusted diluted number of shares outstanding ................... 410.0
Adjusted diluted earnings per share .......................... $ 0.52
Year Ended December 31, 2009
Other
Car Equipment Reconciling
Rental Rental Items Total
Income (loss) before income taxes .......................... $ 184.2 $ (20.7) $(340.4) $(176.9)
Adjustments:
Purchase accounting(a) ................................ 38.2 49.6 2.5 90.3
Non-cash debt charges(b) ............................... 131.7 9.0 31.2 171.9
Restructuring charges(c) ................................ 58.7 38.2 9.9 106.8
Restructuring related charges(c) ........................... 42.3 0.3 3.9 46.5
Derivative (gains) losses(c) .............................. — — (2.4) (2.4)
Third party bankruptcy reserve(d) .......................... 4.3 — — 4.3
Management transition costs(d) ........................... — — 1.0 1.0
Gain on debt buyback(e) ............................... — — (48.5) (48.5)
Adjusted pre-tax income (loss) ............................. 459.4 76.4 (342.8) 193.0
Assumed (provision) benefit for income taxes of 34% ............... (156.2) (26.0) 116.6 (65.6)
Noncontrolling interest .................................. — — (14.7) (14.7)
Adjusted net income (loss) ............................... $ 303.2 $ 50.4 $(240.9) $ 112.7
Adjusted diluted number of shares outstanding ................... 407.7
Adjusted diluted earnings per share .......................... $ 0.28
(a) Represents the increase in amortization of other intangible assets, depreciation of property and equipment and accretion of certain
revalued liabilities relating to purchase accounting.
(b) Represents non-cash debt charges relating to the amortization and write-off of deferred debt financing costs and debt discounts.
For the years ended December 31, 2010 and 2009, also includes $68.9 million and $74.6 million, respectively, associated with the
the amortization of amounts pertaining to the de-designation of our interest rate swaps as effective hedging instruments.
(c) Amounts are included within direct operating and selling, general and administrative expense in our statement of operations.
(d) Amounts are included within selling, general and administrative expense in our statement of operations.
(e) Amounts are included within other (income) expense, net in our statement of operations.