Hertz 2012 Annual Report Download - page 79
Download and view the complete annual report
Please find page 79 of the 2012 Hertz annual report below. You can navigate through the pages in the report by either clicking on the pages listed below, or by using the keyword search tool below to find specific information within the annual report.-
 1
1 -
2
-
3
-
4
-
5
-
6
-
7
-
8
-
9
-
10
-
11
-
12
-
13
-
14
-
15
-
16
-
17
-
18
-
19
-
20
-
21
-
22
-
23
-
24
-
25
-
26
-
27
-
28
-
29
-
30
-
31
-
32
-
33
-
34
-
35
-
36
-
37
-
38
-
39
-
40
-
41
-
42
-
43
-
44
-
45
-
46
-
47
-
48
-
49
-
50
-
51
-
52
-
53
-
54
-
55
-
56
-
57
-
58
-
59
-
60
-
61
-
62
-
63
-
64
-
65
-
66
-
67
-
68
-
 69
69 -
 70
70 -
 71
71 -
 72
72 -
 73
73 -
 74
74 -
 75
75 -
 76
76 -
 77
77 -
 78
78 -
 79
79 -
 80
80 -
 81
81 -
 82
82 -
 83
83 -
 84
84 -
 85
85 -
 86
86 -
 87
87 -
 88
88 -
 89
89 -
90
-
91
-
92
-
93
-
94
-
95
-
96
-
97
-
98
-
99
-
100
-
101
-
102
-
103
-
104
-
105
-
106
-
107
-
108
-
109
-
110
-
111
-
112
-
113
-
114
-
115
-
116
-
117
-
118
-
119
-
120
-
121
-
122
-
123
-
124
-
125
-
126
-
127
-
128
-
129
-
130
-
131
-
132
-
133
-
134
-
135
-
136
-
137
-
138
-
139
-
140
-
141
-
142
-
143
-
144
-
145
-
146
-
147
-
148
-
149
-
150
-
151
-
152
-
153
-
154
-
155
-
156
-
157
-
158
-
159
-
160
-
161
-
162
-
163
-
164
-
165
-
166
-
167
-
168
-
169
-
170
-
171
-
172
-
173
-
174
-
175
-
176
-
177
-
178
-
179
-
180
-
181
-
182
-
183
-
184
-
185
-
186
-
187
-
188
-
189
-
190
-
191
-
192
-
193
-
194
-
195
-
196
-
197
-
198
-
199
-
200
-
201
-
202
-
203
-
204
-
205
-
206
-
207
-
208
-
209
-
210
-
211
-
212
-
213
-
214
-
215
-
216
-
217
-
218
-
219
-
220
-
221
-
222
-
223
-
224
-
225
-
226
-
227
-
228
-
229
-
230
-
231
-
232
-
233
-
234
-
235
-
236
-
237
-
238
 |
 |
ITEM 7. MANAGEMENT’S DISCUSSION AND ANALYSIS OF FINANCIAL CONDITION AND
RESULTS OF OPERATIONS (Continued)
Car Rental
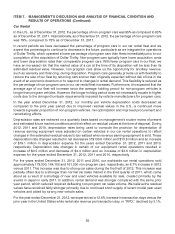
In the U.S., as of December 31, 2012, the percentage of non-program cars was 95% as compared to 83%
as of December 31, 2011. Internationally, as of December 31, 2012, the percentage of non-program cars
was 79%, compared to 75% as of December 31, 2011.
In recent periods we have decreased the percentage of program cars in our car rental fleet and we
expect this percentage to continue to decrease in the future, particularly as we integrate the operations
of Dollar Thrifty, which operated a lower percentage of program cars than Hertz immediately prior to our
completion of the acquisition of Dollar Thrifty. Non-program cars typically have lower acquisition costs
and lower depreciation rates than comparable program cars. With fewer program cars in our fleet, we
have an increased risk that the market value of a car at the time of its disposition will be less than its
estimated residual value. However, non-program cars allow us the opportunity for ancillary revenue,
such as warranty and financing, during disposition. Program cars generally provide us with flexibility to
reduce the size of our fleet by returning cars sooner than originally expected without risk of loss in the
event of an economic downturn or to respond to changes in rental demand. This flexibility is reduced as
the percentage of non-program cars in our car rental fleet increases. Furthermore, it is expected that the
average age of our fleet will increase since the average holding period for non-program vehicles is
longer than program vehicles. However, the longer holding period does not necessarily equate to higher
costs due to the stringent turnback requirements imposed by vehicle manufacturers for program cars.
In the year ended December 31, 2012, our monthly per vehicle depreciation costs decreased as
compared to the prior year period due to improved residual values in the U.S., a continued move
towards a greater proportion of non-program vehicles, mix optimization and improved procurement and
remarketing efforts.
Depreciation rates are reviewed on a quarterly basis based on management’s routine review of present
and estimated future market conditions and their effect on residual values at the time of disposal. During
2012, 2011 and 2010, depreciation rates being used to compute the provision for depreciation of
revenue earning equipment were adjusted on certain vehicles in our car rental operations to reflect
changes in the estimated residual values to be realized when revenue earning equipment is sold. These
depreciation rate changes resulted in net decreases of $130.6 million and $13.8 million and an increase
of $19.1 million in depreciation expense for the years ended December 31, 2012, 2011 and 2010,
respectively. Depreciation rate changes in certain of our equipment rental operations resulted in
increase of $0.5 million and decrease of $4.4 million and an increase of $3.6 million in depreciation
expense for the years ended December 31, 2012, 2011 and 2010, respectively.
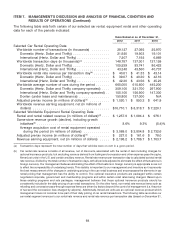
For the years ended December 31, 2012, 2011 and 2010, our worldwide car rental operations sold
approximately 178,300, 164,100 and 161,200 non-program cars, respectively, an 8.7% increase in 2012
versus 2011. This increase was due to strong car sales during the first half of 2012. This increase was
partially offset due to a stronger than normal car sales market in the third quarter of 2011, which came
about as a result of a shortage of new and used vehicles available for sale, created primarily by the
events in Japan in early 2011. In addition, rental demand was stronger compared with the same prior
year period, which reduced required defleeting non-program car sales volume. We believe the residual
values have remained fairly stronger primarily due to continued short supply of recent model year used
vehicles and aided by strong new vehicle sales.
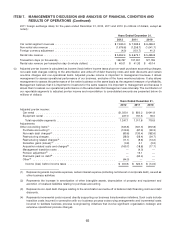
For the year ended December 31, 2012, we experienced a 12.6% increase in transaction days versus the
prior year in the United States while rental rate revenue per transaction day, or ‘‘RPD,’’ declined by 3.1%.
55