Hertz 2012 Annual Report Download - page 103
Download and view the complete annual report
Please find page 103 of the 2012 Hertz annual report below. You can navigate through the pages in the report by either clicking on the pages listed below, or by using the keyword search tool below to find specific information within the annual report.-
 1
1 -
2
-
3
-
4
-
5
-
6
-
7
-
8
-
9
-
10
-
11
-
12
-
13
-
14
-
15
-
16
-
17
-
18
-
19
-
20
-
21
-
22
-
23
-
24
-
25
-
26
-
27
-
28
-
29
-
30
-
31
-
32
-
33
-
34
-
35
-
36
-
37
-
38
-
39
-
40
-
41
-
42
-
43
-
44
-
45
-
46
-
47
-
48
-
49
-
50
-
51
-
52
-
53
-
54
-
55
-
56
-
57
-
58
-
59
-
60
-
61
-
62
-
63
-
64
-
65
-
66
-
67
-
68
-
69
-
70
-
71
-
72
-
73
-
74
-
75
-
76
-
77
-
78
-
79
-
80
-
81
-
82
-
83
-
84
-
85
-
86
-
87
-
88
-
89
-
90
-
91
-
92
-
 93
93 -
 94
94 -
 95
95 -
 96
96 -
 97
97 -
 98
98 -
 99
99 -
 100
100 -
 101
101 -
 102
102 -
 103
103 -
 104
104 -
 105
105 -
 106
106 -
 107
107 -
 108
108 -
 109
109 -
 110
110 -
 111
111 -
 112
112 -
 113
113 -
114
-
115
-
116
-
117
-
118
-
119
-
120
-
121
-
122
-
123
-
124
-
125
-
126
-
127
-
128
-
129
-
130
-
131
-
132
-
133
-
134
-
135
-
136
-
137
-
138
-
139
-
140
-
141
-
142
-
143
-
144
-
145
-
146
-
147
-
148
-
149
-
150
-
151
-
152
-
153
-
154
-
155
-
156
-
157
-
158
-
159
-
160
-
161
-
162
-
163
-
164
-
165
-
166
-
167
-
168
-
169
-
170
-
171
-
172
-
173
-
174
-
175
-
176
-
177
-
178
-
179
-
180
-
181
-
182
-
183
-
184
-
185
-
186
-
187
-
188
-
189
-
190
-
191
-
192
-
193
-
194
-
195
-
196
-
197
-
198
-
199
-
200
-
201
-
202
-
203
-
204
-
205
-
206
-
207
-
208
-
209
-
210
-
211
-
212
-
213
-
214
-
215
-
216
-
217
-
218
-
219
-
220
-
221
-
222
-
223
-
224
-
225
-
226
-
227
-
228
-
229
-
230
-
231
-
232
-
233
-
234
-
235
-
236
-
237
-
238
 |
 |

ITEM 7. MANAGEMENT’S DISCUSSION AND ANALYSIS OF FINANCIAL CONDITION AND
RESULTS OF OPERATIONS (Continued)
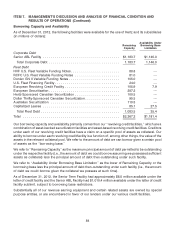
Our primary use of cash in investing activities is for the acquisition of revenue earning equipment, which
consists of cars and equipment. During the year ended December 31, 2012, we used $2,553.9 million
more cash for investing activities compared with the same period in 2011. The increase in the use of
funds was primarily due to the Dollar Thrifty acquisition along with other acquisitions during the year,
decreases in proceeds from the disposal of revenue earning equipment, a decrease in the
year-over-year change in restricted cash and cash equivalents and revenue earning equipment
expenditures during the year. As of December 31, 2012 and 2011, we had $571.6 million and
$308.0 million, respectively, of restricted cash and cash equivalents to be used for the purchase of
revenue earning vehicles and other specified uses under our fleet financing facilities, our Like Kind
Exchange Program, or ‘‘LKE Program,’’ and to satisfy certain of our self-insurance regulatory reserve
requirements. The increase in restricted cash and cash equivalents of $263.6 million from December 31,
2011 to December 31, 2012, primarily related to the acquisition of Dollar Thrifty.
During the year ended December 31, 2012, cash flows from financing activities increased by
$3,111.2 million compared with the same period in 2011. The increase was primarily related to the 2012
issuance of incremental Senior Notes and incurrence of incremental Term Loans related to the Dollar
Thrifty acquisition and higher payments of pre-funded debt associated with our Senior Note
redemptions in the prior year.
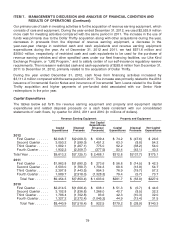
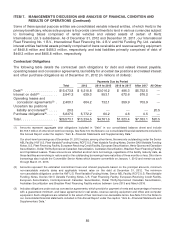
Capital Expenditures
The tables below set forth the revenue earning equipment and property and equipment capital
expenditures and related disposal proceeds on a cash basis consistent with our consolidated
statements of cash flows, by quarter for 2012, 2011 and 2010 (in millions of dollars).
Revenue Earning Equipment Property and Equipment
Net Capital
Expenditures
Capital Disposal (Disposal Capital Disposal Net Capital
Expenditures Proceeds Proceeds) Expenditures Proceeds Expenditures
2012
First Quarter ...... $2,648.7 $(2,009.3) $ 639.4 $ 74.2 $ (47.6) $ 26.6
Second Quarter .... 3,050.2 (1,599.0) 1,451.2 63.0 (8.8) 54.2
Third Quarter ...... 1,982.1 (1,207.1) 775.0 92.2 (38.2) 54.0
Fourth Quarter ..... 1,932.2 (2,309.7) (377.5) 83.4 (43.1) 40.3
Total Year .......... $9,613.2 $(7,125.1) $ 2,488.1 $312.8 $(137.7) $175.1
2011
First Quarter ...... $1,963.8 $(1,690.2) $ 273.6 $ 56.8 $ (14.5) $ 42.3
Second Quarter .... 3,503.0 (1,798.7) 1,704.3 68.6 (13.9) 54.7
Third Quarter ...... 2,397.8 (1,443.5) 954.3 76.9 (19.7) 57.2
Fourth Quarter ..... 1,589.7 (2,918.0) (1,328.3) 79.4 (5.7) 73.7
Total Year ....... $9,454.3 $(7,850.4) $ 1,603.9 $281.7 $ (53.8) $227.9
2010
First Quarter ...... $2,214.5 $(1,606.4) $ 608.1 $ 51.3 $ (6.7) $ 44.6
Second Quarter .... 3,102.8 (1,836.8) 1,266.0 40.7 (8.5) 32.2
Third Quarter ...... 1,796.4 (1,702.8) 93.6 42.3 (10.3) 32.0
Fourth Quarter ..... 1,327.2 (2,372.4) (1,045.2) 44.9 (13.4) 31.5
Total Year ....... $8,440.9 $(7,518.4) $ 922.5 $179.2 $ (38.9) $140.3
79