Hertz 2012 Annual Report Download - page 232
Download and view the complete annual report
Please find page 232 of the 2012 Hertz annual report below. You can navigate through the pages in the report by either clicking on the pages listed below, or by using the keyword search tool below to find specific information within the annual report.-
 1
1 -
2
-
3
-
4
-
5
-
6
-
7
-
8
-
9
-
10
-
11
-
12
-
13
-
14
-
15
-
16
-
17
-
18
-
19
-
20
-
21
-
22
-
23
-
24
-
25
-
26
-
27
-
28
-
29
-
30
-
31
-
32
-
33
-
34
-
35
-
36
-
37
-
38
-
39
-
40
-
41
-
42
-
43
-
44
-
45
-
46
-
47
-
48
-
49
-
50
-
51
-
52
-
53
-
54
-
55
-
56
-
57
-
58
-
59
-
60
-
61
-
62
-
63
-
64
-
65
-
66
-
67
-
68
-
69
-
70
-
71
-
72
-
73
-
74
-
75
-
76
-
77
-
78
-
79
-
80
-
81
-
82
-
83
-
84
-
85
-
86
-
87
-
88
-
89
-
90
-
91
-
92
-
93
-
94
-
95
-
96
-
97
-
98
-
99
-
100
-
101
-
102
-
103
-
104
-
105
-
106
-
107
-
108
-
109
-
110
-
111
-
112
-
113
-
114
-
115
-
116
-
117
-
118
-
119
-
120
-
121
-
122
-
123
-
124
-
125
-
126
-
127
-
128
-
129
-
130
-
131
-
132
-
133
-
134
-
135
-
136
-
137
-
138
-
139
-
140
-
141
-
142
-
143
-
144
-
145
-
146
-
147
-
148
-
149
-
150
-
151
-
152
-
153
-
154
-
155
-
156
-
157
-
158
-
159
-
160
-
161
-
162
-
163
-
164
-
165
-
166
-
167
-
168
-
169
-
170
-
171
-
172
-
173
-
174
-
175
-
176
-
177
-
178
-
179
-
180
-
181
-
182
-
183
-
184
-
185
-
186
-
187
-
188
-
189
-
190
-
191
-
192
-
193
-
194
-
195
-
196
-
197
-
198
-
199
-
200
-
201
-
202
-
203
-
204
-
205
-
206
-
207
-
208
-
209
-
210
-
211
-
212
-
213
-
214
-
215
-
216
-
217
-
218
-
219
-
220
-
221
-
 222
222 -
 223
223 -
 224
224 -
 225
225 -
 226
226 -
 227
227 -
 228
228 -
 229
229 -
 230
230 -
 231
231 -
 232
232 -
 233
233 -
 234
234 -
 235
235 -
 236
236 -
 237
237 -
 238
238
 |
 |

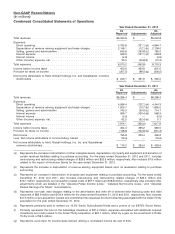
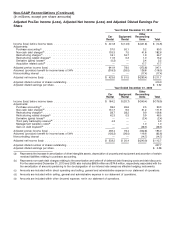
Non-GAAP Reconciliations (Continued)
(In millions)
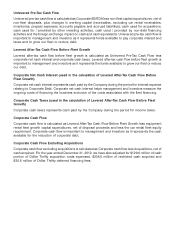
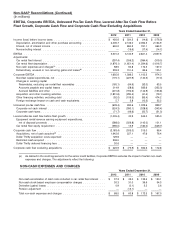
EBITDA, Corporate EBITDA, Unlevered Pre-Tax Cash Flow, Levered After-Tax Cash Flow Before
Fleet Growth, Corporate Cash Flow and Corporate Cash Flow Excluding Acquisitions
Years Ended December 31,
2012 2011 2010 2009
Income (loss) before income taxes ............................ $ 450.6 $ 324.3 $ (14.6) $ (176.9)
Depreciation, amortization and other purchase accounting ............ 2,405.7 2,136.0 2,092.3 2,164.9
Interest, net of interest income ............................. 645.0 694.2 761.1 664.3
Noncontrolling interest .................................. — (19.6) (17.4) (14.7)
EBITDA ............................................ 3,501.3 3,134.9 2,821.4 2,637.6
Adjustments:
Car rental fleet interest .................................. (297.4) (306.2) (384.4) (319.0)
Car rental fleet depreciation ............................... (1,876.1) (1,651.4) (1,594.6) (1,616.7)
Non-cash expenses and charges(a) ........................... 68.5 60.8 172.3 167.0
Extraordinary, unusual or non-recurring gains and losses(b) ............ 239.3 151.4 85.6 105.1
Corporate EBITDA ...................................... 1,635.6 1,389.5 1,100.3 974.0
Non-fleet capital expenditures, net ........................... (175.1) (227.9) (140.3) (77.0)
Changes in working capital
Receivables, excluding car rental fleet receivables ................ (165.1) (64.9) (32.0) 63.5
Accounts payable and capital leases ........................ 214.9 (58.6) 383.6 (335.3)
Accrued liabilities and other ............................. (201.8) (192.6) (142.9) (155.8)
Acquisition and other investing activities ........................ (1,831.6) (259.4) (41.4) (79.1)
Other financing activities, excluding debt ....................... (92.0) (109.3) (93.4) 474.2
Foreign exchange impact on cash and cash equivalents ............. 5.7 3.8 (10.3) 35.2
Unlevered pre-tax cash flow ................................ (609.4) 480.6 1,023.6 899.7
Corporate net cash interest ............................... (324.3) (390.1) (328.9) (343.4)
Corporate cash taxes ................................... (71.7) (49.6) (50.7) (31.3)
Levered after-tax cash flow before fleet growth ..................... (1,005.4) 40.9 644.0 525.0
Equipment rental revenue earning equipment expenditures,
net of disposal proceeds ............................... (588.0) (359.8) (145.0) 101.1
Car rental fleet equity requirement ........................... (590.0) 15.9 (184.0) (529.7)
Corporate cash flow ..................................... (2,183.4) (303.0) 315.0 96.4
Acquisitions, net of cash acquired(d) .......................... 1,942.6 227.1 47.6 76.4
Dollar Thrifty acquisition costs expensed ....................... 129.6———
Restricted cash acquired ................................. 306.5———
Dollar Thrifty deferred financing fees .......................... 30.6 — — —
Corporate cash flow excluding acquisitions ....................... $ 225.9 $ (75.9) $ 362.6 $ 172.8
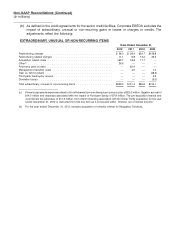
(a) As defined in the credit agreements for the senior credit facilities, Corporate EBITDA excludes the impact of certain non-cash
expenses and charges. The adjustments reflect the following:
NON-CASH EXPENSES AND CHARGES
Years Ended December 31,
2012 2011 2010 2009
Non-cash amortization of debt costs included in car rental fleet interest . . . $ 37.3 $ 43.0 $ 132.5 $ 130.1
Non-cash stock-based employee compensation charges ............ 30.3 31.0 36.6 34.3
Derivative (gains) losses ................................ 0.9 (0.1) 3.2 2.6
Pension adjustment .................................. — (13.1) — —
Total non-cash expenses and charges ....................... $ 68.5 $ 60.8 $ 172.3 $ 167.0