Hertz 2012 Annual Report Download - page 96
Download and view the complete annual report
Please find page 96 of the 2012 Hertz annual report below. You can navigate through the pages in the report by either clicking on the pages listed below, or by using the keyword search tool below to find specific information within the annual report.-
 1
1 -
2
-
3
-
4
-
5
-
6
-
7
-
8
-
9
-
10
-
11
-
12
-
13
-
14
-
15
-
16
-
17
-
18
-
19
-
20
-
21
-
22
-
23
-
24
-
25
-
26
-
27
-
28
-
29
-
30
-
31
-
32
-
33
-
34
-
35
-
36
-
37
-
38
-
39
-
40
-
41
-
42
-
43
-
44
-
45
-
46
-
47
-
48
-
49
-
50
-
51
-
52
-
53
-
54
-
55
-
56
-
57
-
58
-
59
-
60
-
61
-
62
-
63
-
64
-
65
-
66
-
67
-
68
-
69
-
70
-
71
-
72
-
73
-
74
-
75
-
76
-
77
-
78
-
79
-
80
-
81
-
82
-
83
-
84
-
85
-
 86
86 -
 87
87 -
 88
88 -
 89
89 -
 90
90 -
 91
91 -
 92
92 -
 93
93 -
 94
94 -
 95
95 -
 96
96 -
 97
97 -
 98
98 -
 99
99 -
 100
100 -
 101
101 -
 102
102 -
 103
103 -
 104
104 -
 105
105 -
 106
106 -
107
-
108
-
109
-
110
-
111
-
112
-
113
-
114
-
115
-
116
-
117
-
118
-
119
-
120
-
121
-
122
-
123
-
124
-
125
-
126
-
127
-
128
-
129
-
130
-
131
-
132
-
133
-
134
-
135
-
136
-
137
-
138
-
139
-
140
-
141
-
142
-
143
-
144
-
145
-
146
-
147
-
148
-
149
-
150
-
151
-
152
-
153
-
154
-
155
-
156
-
157
-
158
-
159
-
160
-
161
-
162
-
163
-
164
-
165
-
166
-
167
-
168
-
169
-
170
-
171
-
172
-
173
-
174
-
175
-
176
-
177
-
178
-
179
-
180
-
181
-
182
-
183
-
184
-
185
-
186
-
187
-
188
-
189
-
190
-
191
-
192
-
193
-
194
-
195
-
196
-
197
-
198
-
199
-
200
-
201
-
202
-
203
-
204
-
205
-
206
-
207
-
208
-
209
-
210
-
211
-
212
-
213
-
214
-
215
-
216
-
217
-
218
-
219
-
220
-
221
-
222
-
223
-
224
-
225
-
226
-
227
-
228
-
229
-
230
-
231
-
232
-
233
-
234
-
235
-
236
-
237
-
238
 |
 |

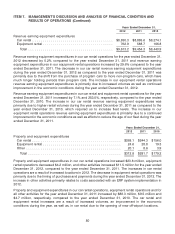
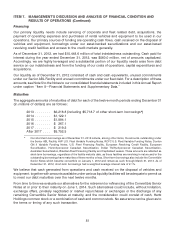
ITEM 7. MANAGEMENT’S DISCUSSION AND ANALYSIS OF FINANCIAL CONDITION AND
RESULTS OF OPERATIONS (Continued)
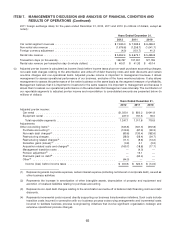
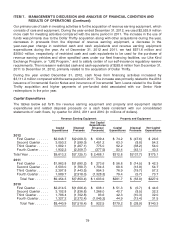
PROVISION FOR TAXES ON INCOME, NET INCOME ATTRIBUTABLE TO NONCONTROLLING
INTEREST AND NET INCOME ATTRIBUTABLE TO HERTZ GLOBAL HOLDINGS, INC.
AND SUBSIDIARIES’ COMMON STOCKHOLDERS
Years Ended
December 31,
2012 2011 $ Change % Change
(in millions of dollars)
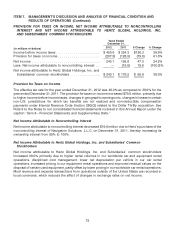
Income before income taxes ...................... $450.6 $ 324.3 $126.3 38.9%
Provision for taxes on income ..................... (207.5) (128.5) (79.0) 61.5%
Net income .................................. 243.1 195.8 47.3 24.2%
Less: Net income attributable to noncontrolling interest . . — (19.6) 19.6 (100.0)%
Net income attributable to Hertz Global Holdings, Inc. and
Subsidiaries’ common stockholders ............... $243.1 $ 176.2 $ 66.9 38.0%
Provision for Taxes on Income
The effective tax rate for the year ended December 31, 2012 was 46.0% as compared to 39.6% for the
year ended December 31, 2011. The provision for taxes on income increased $79.0 million, primarily due
to higher income before income taxes, changes in geographic earnings mix, changes in losses in certain
non-U.S. jurisdictions for which tax benefits are not realized and non-deductible compensation
payments under Internal Revenue Code Section 280(G) related to the Dollar Thrifty acquisition. See
Note 9 to the Notes to our consolidated financial statements included in this Annual Report under the
caption ‘‘Item 8—Financial Statements and Supplementary Data.’’
Net Income Attributable to Noncontrolling Interest
Net income attributable to noncontrolling interest decreased $19.6 million due to Hertz’s purchase of the
noncontrolling interest of Navigation Solutions, L.L.C. on December 31, 2011, thereby increasing its
ownership interest from 65% to 100%.
Net Income Attributable to Hertz Global Holdings, Inc. and Subsidiaries’ Common
Stockholders
Net income attributable to Hertz Global Holdings, Inc. and Subsidiaries’ common stockholders
increased 38.0% primarily due to higher rental volumes in our worldwide car and equipment rental
operations, disciplined cost management, lower net depreciation per vehicle in our car rental
operations, increased pricing in our equipment rental operations and improved residual values on the
disposal of certain used equipment, partly offset by lower pricing in our worldwide car rental operations.
Most revenue and expense transactions from operations outside of the United States are recorded in
local currencies, which reduces the effect of changes in exchange rates on net income.
72