Hasbro 2015 Annual Report Download - page 94
Download and view the complete annual report
Please find page 94 of the 2015 Hasbro annual report below. You can navigate through the pages in the report by either clicking on the pages listed below, or by using the keyword search tool below to find specific information within the annual report.-
 1
1 -
2
-
3
-
4
-
5
-
6
-
7
-
8
-
9
-
10
-
11
-
12
-
13
-
14
-
15
-
16
-
17
-
18
-
19
-
20
-
21
-
22
-
23
-
24
-
25
-
26
-
27
-
28
-
29
-
30
-
31
-
32
-
33
-
34
-
35
-
36
-
37
-
38
-
39
-
40
-
41
-
42
-
43
-
44
-
45
-
46
-
47
-
48
-
49
-
50
-
51
-
52
-
53
-
54
-
55
-
56
-
57
-
58
-
59
-
60
-
61
-
62
-
63
-
64
-
65
-
66
-
67
-
68
-
69
-
70
-
71
-
72
-
73
-
74
-
75
-
76
-
77
-
78
-
79
-
80
-
81
-
82
-
83
-
 84
84 -
 85
85 -
 86
86 -
 87
87 -
 88
88 -
 89
89 -
 90
90 -
 91
91 -
 92
92 -
 93
93 -
 94
94 -
 95
95 -
 96
96 -
 97
97 -
 98
98 -
 99
99 -
 100
100 -
 101
101 -
 102
102 -
 103
103 -
 104
104 -
105
-
106
-
107
-
108
-
109
-
110
-
111
-
112
-
113
-
114
-
115
-
116
-
117
-
118
-
119
-
120
-
121
-
122
-
123
-
124
-
125
-
126
 |
 |

HASBRO, INC. AND SUBSIDIARIES
Notes to Consolidated Financial Statements — (Continued)
(Thousands of Dollars and Shares Except Per Share Data)
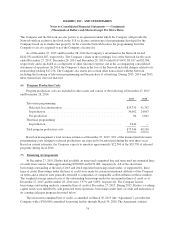
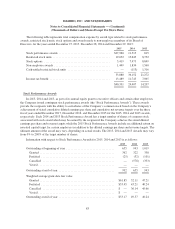
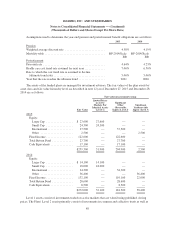
The following table represents total compensation expense by award type related to stock performance
awards, restricted stock units, stock options and awards made to non-employee members of its Board of
Directors, for the years ended December 27, 2015, December 28, 2014 and December 29, 2013:
2015 2014 2013
Stock performance awards ................................... $27,960 11,315 815
Restricted stock units ....................................... 19,052 15,643 8,732
Stock options ............................................. 5,419 7,473 8,849
Non-employee awards ...................................... 1,449 1,834 1,560
Cash-settled restricted stock units ............................. — (113) 1,316
53,880 36,152 21,272
Income tax benefit ......................................... 13,489 11,745 7,065
$40,391 24,407 14,207
Stock Performance Awards
In 2015, 2014 and 2013, as part of its annual equity grant to executive officers and certain other employees,
the Company issued contingent stock performance awards (the “Stock Performance Awards”). These awards
provide the recipients with the ability to earn shares of the Company’s common stock based on the Company’s
achievement of stated cumulative diluted earnings per share and cumulative net revenue targets over the three
fiscal years ended December 2017, December 2016, and December 2015 for the 2015, 2014 and 2013 awards,
respectively. Each 2014 and 2013 Stock Performance Award has a target number of shares of common stock
associated with such award which may be earned by the recipient if the Company achieves the stated diluted
earnings per share and revenue targets while the 2015 Stock Performance Awards include an additional return on
invested capital target for certain employees in addition to the diluted earnings per share and revenue targets. The
ultimate amount of the award may vary, depending on actual results. The 2013, 2014 and 2015 Awards may vary
from 0% to 200% of the target number of shares.
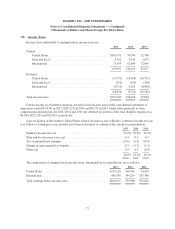
Information with respect to Stock Performance Awards for 2015, 2014 and 2013 is as follows:
2015 2014 2013
Outstanding at beginning of year ................................. 655 943 1,019
Granted ................................................... 362 322 358
Forfeited .................................................. (25) (32) (101)
Cancelled ................................................. — (578) (333)
Vested .................................................... — — —
Outstanding at end of year ...................................... 992 655 943
Weighted average grant-date fair value:
Granted ................................................... $61.85 52.11 47.21
Forfeited .................................................. $53.45 43.21 40.24
Cancelled ................................................. $ — 36.14 45.66
Vested .................................................... $ — — —
Outstanding at end of year ...................................... $53.17 49.57 40.24
83