Hasbro 2015 Annual Report Download - page 82
Download and view the complete annual report
Please find page 82 of the 2015 Hasbro annual report below. You can navigate through the pages in the report by either clicking on the pages listed below, or by using the keyword search tool below to find specific information within the annual report.-
 1
1 -
2
-
3
-
4
-
5
-
6
-
7
-
8
-
9
-
10
-
11
-
12
-
13
-
14
-
15
-
16
-
17
-
18
-
19
-
20
-
21
-
22
-
23
-
24
-
25
-
26
-
27
-
28
-
29
-
30
-
31
-
32
-
33
-
34
-
35
-
36
-
37
-
38
-
39
-
40
-
41
-
42
-
43
-
44
-
45
-
46
-
47
-
48
-
49
-
50
-
51
-
52
-
53
-
54
-
55
-
56
-
57
-
58
-
59
-
60
-
61
-
62
-
63
-
64
-
65
-
66
-
67
-
68
-
69
-
70
-
71
-
 72
72 -
 73
73 -
 74
74 -
 75
75 -
 76
76 -
 77
77 -
 78
78 -
 79
79 -
 80
80 -
 81
81 -
 82
82 -
 83
83 -
 84
84 -
 85
85 -
 86
86 -
 87
87 -
 88
88 -
 89
89 -
 90
90 -
 91
91 -
 92
92 -
93
-
94
-
95
-
96
-
97
-
98
-
99
-
100
-
101
-
102
-
103
-
104
-
105
-
106
-
107
-
108
-
109
-
110
-
111
-
112
-
113
-
114
-
115
-
116
-
117
-
118
-
119
-
120
-
121
-
122
-
123
-
124
-
125
-
126
 |
 |

HASBRO, INC. AND SUBSIDIARIES
Notes to Consolidated Financial Statements — (Continued)
(Thousands of Dollars and Shares Except Per Share Data)
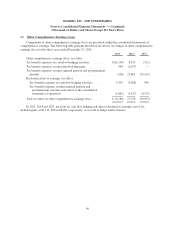
deferred losses, net of tax, of $19,363 related to these instruments remained in AOCE. For the years ended
December 27, 2015 and December 28, 2014, losses, net of tax of $1,148 and $1,156, respectively, were
reclassified from AOCE to net earnings.
Of the net deferred gains included in AOCE at December 27, 2015, the Company expects approximately
$63,181 to be reclassified to the consolidated statements of operations within the next 12 months. However, the
amount ultimately realized in earnings is dependent on the fair value of the hedging instruments on the settlement
dates.
See notes 14 and 16 for additional discussion on reclassifications from AOCE to earnings.
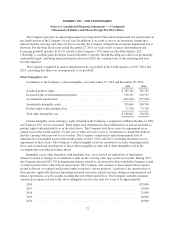
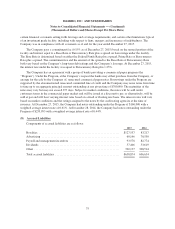
(3) Property, Plant and Equipment
2015 2014
Land and improvements ........................................... $ 3,954 6,784
Buildings and improvements ........................................ 176,982 234,149
Machinery, equipment and software .................................. 350,471 447,434
531,407 688,367
Less accumulated depreciation ...................................... 363,601 508,600
167,806 179,767
Tools, dies and molds, net of accumulated depreciation .................. 69,721 57,722
Total property, plant and equipment, net .............................. $237,527 237,489
Expenditures for maintenance and repairs which do not materially extend the life of the assets are charged to
operations as incurred.
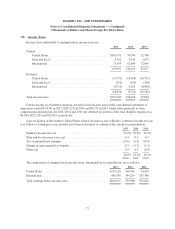
(4) Goodwill and Intangibles
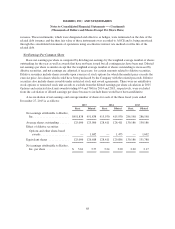
Goodwill
Changes in the carrying amount of goodwill, by operating segment, for the years ended December 27, 2015
and December 28, 2014 are as follows:
U.S. and
Canada International
Entertainment
and Licensing Total
2015
Balance at December 28, 2014 ............. $296,978 170,853 125,607 593,438
Foreign exchange translation .............. — (743) — (743)
Balance at December 27, 2015 ............. $296,978 170,110 125,607 592,695
2014
Balance at December 29, 2013 ............. $296,978 171,736 125,607 594,321
Foreign exchange translation .............. — (883) — (883)
Balance at December 28, 2014 ............. $296,978 170,853 125,607 593,438
A portion of the Company’s goodwill and other intangible assets reside in the Corporate segment of the
business. For purposes of the goodwill impairment testing, these assets are allocated to the reporting units within
the Company’s operating segments.
71