Hasbro 2015 Annual Report Download - page 53
Download and view the complete annual report
Please find page 53 of the 2015 Hasbro annual report below. You can navigate through the pages in the report by either clicking on the pages listed below, or by using the keyword search tool below to find specific information within the annual report.-
 1
1 -
2
-
3
-
4
-
5
-
6
-
7
-
8
-
9
-
10
-
11
-
12
-
13
-
14
-
15
-
16
-
17
-
18
-
19
-
20
-
21
-
22
-
23
-
24
-
25
-
26
-
27
-
28
-
29
-
30
-
31
-
32
-
33
-
34
-
35
-
36
-
37
-
38
-
39
-
40
-
41
-
42
-
 43
43 -
 44
44 -
 45
45 -
 46
46 -
 47
47 -
 48
48 -
 49
49 -
 50
50 -
 51
51 -
 52
52 -
 53
53 -
 54
54 -
 55
55 -
 56
56 -
 57
57 -
 58
58 -
 59
59 -
 60
60 -
 61
61 -
 62
62 -
 63
63 -
64
-
65
-
66
-
67
-
68
-
69
-
70
-
71
-
72
-
73
-
74
-
75
-
76
-
77
-
78
-
79
-
80
-
81
-
82
-
83
-
84
-
85
-
86
-
87
-
88
-
89
-
90
-
91
-
92
-
93
-
94
-
95
-
96
-
97
-
98
-
99
-
100
-
101
-
102
-
103
-
104
-
105
-
106
-
107
-
108
-
109
-
110
-
111
-
112
-
113
-
114
-
115
-
116
-
117
-
118
-
119
-
120
-
121
-
122
-
123
-
124
-
125
-
126
 |
 |

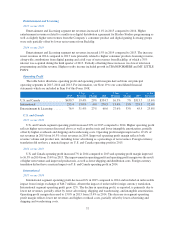
2013 reflects continued investment in emerging markets and certain brands, primarily MAGIC: THE
GATHERING, a full year of expense related to Backflip, higher performance-based stock compensation and
increased depreciation expense associated with investments in information systems.
NON-OPERATING (INCOME) EXPENSE
Interest Expense
Interest expense totaled $97.1 million in 2015 compared to $93.1 million in 2014 and $105.6 million in
2013. The increase in interest expense in 2015 compared to 2014 primarily reflects the impact of costs related to
forward-starting interest rate swap contracts on the 2014 debt issuance compared to a benefit on interest rate
hedges which expired in 2014. Interest expense in 2013 included approximately $15.1 million related to the
settlement of an arbitration award. Absent these charges, interest expense totaled $90.5 million in 2013. The
increase in interest expense in 2014 compared to the 2013 adjusted total primarily reflects the higher benefit of
interest rate swap agreements in effect in 2013, partially offset by the benefit of lower interest rates on long-term
debt.
Interest Income
Interest income was $3.1 million in 2015 compared to $3.8 million in 2014 and $4.9 million in 2013. Lower
interest income in 2015 compared to 2014 reflects lower average interest rates which were only partially offset
by higher average cash balances. Decreased interest income in 2014 compared to 2013 reflects lower average
cash balances. Average interest rates for 2014 and 2013 were consistent.
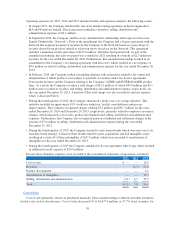
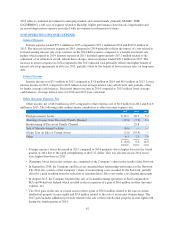
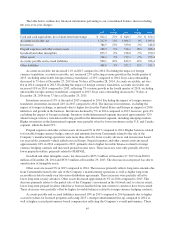
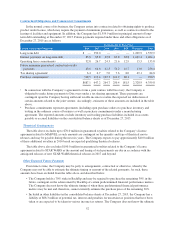
Other (Income) Expense, Net
Other income, net of $6.0 million in 2015 compared to other expense, net of $6.0 million in 2014 and $14.6
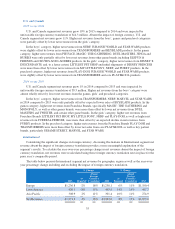
million in 2013. The following table outlines major contributors to other (income) expense, net.
2015 2014 2013
Foreign currency losses .......................................... $16.1 20.9 5.2
(Earnings) Losses from Discovery Family Channel .................... (19.0) (7.8) 2.4
Restructuring of Discovery Family Channel .......................... — 29.8 —
Sale of Manufacturing Facilities ................................... (6.6) — —
(Gain) Loss on Sale of Certain Assets ............................... (2.8) (39.4) —
Other ........................................................ 6.3 2.5 7.0
$ (6.0) 6.0 14.6
• Foreign currency losses decreased in 2015 compared to 2014 primarily due to higher losses in the fourth
quarter of 2014 due to the rapid strengthening of the U.S. dollar. This was also the reason 2014 losses
were higher than those in 2013.
• (Earnings) losses from joint ventures are comprised of the Company’s share in the results of the Network.
• In September 2014, the Company and Discovery amended their relationship with respect to the Network.
The 2014 loss consists of the Company’s share of restructuring costs recorded by the Network, partially
offset by a gain resulting from the reduction of amounts due to Discovery under a tax sharing agreement.
• In August 2015, the Company finalized the sale of its manufacturing operations in East Longmeadow,
MA and Waterford, Ireland which resulted in the recognition of a gain of $6.6 million in other (income)
expense, net.
• The 2014 gain on the sale of certain assets reflects gains of $36.0 million related to the sale of certain
intellectual property license rights and $3.4 million related to the sale of an internet domain name. The
2015 gain includes additional proceeds related to the sale of those intellectual property license rights sold
during the fourth quarter of 2014.
42