Hasbro 2015 Annual Report Download - page 48
Download and view the complete annual report
Please find page 48 of the 2015 Hasbro annual report below. You can navigate through the pages in the report by either clicking on the pages listed below, or by using the keyword search tool below to find specific information within the annual report.-
 1
1 -
2
-
3
-
4
-
5
-
6
-
7
-
8
-
9
-
10
-
11
-
12
-
13
-
14
-
15
-
16
-
17
-
18
-
19
-
20
-
21
-
22
-
23
-
24
-
25
-
26
-
27
-
28
-
29
-
30
-
31
-
32
-
33
-
34
-
35
-
36
-
37
-
 38
38 -
 39
39 -
 40
40 -
 41
41 -
 42
42 -
 43
43 -
 44
44 -
 45
45 -
 46
46 -
 47
47 -
 48
48 -
 49
49 -
 50
50 -
 51
51 -
 52
52 -
 53
53 -
 54
54 -
 55
55 -
 56
56 -
 57
57 -
 58
58 -
59
-
60
-
61
-
62
-
63
-
64
-
65
-
66
-
67
-
68
-
69
-
70
-
71
-
72
-
73
-
74
-
75
-
76
-
77
-
78
-
79
-
80
-
81
-
82
-
83
-
84
-
85
-
86
-
87
-
88
-
89
-
90
-
91
-
92
-
93
-
94
-
95
-
96
-
97
-
98
-
99
-
100
-
101
-
102
-
103
-
104
-
105
-
106
-
107
-
108
-
109
-
110
-
111
-
112
-
113
-
114
-
115
-
116
-
117
-
118
-
119
-
120
-
121
-
122
-
123
-
124
-
125
-
126
 |
 |

Entertainment and Licensing
2015 versus 2014
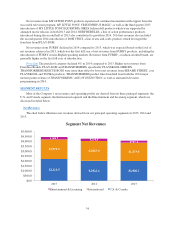
Entertainment and Licensing segment net revenues increased 11% in 2015 compared to 2014. Higher
entertainment revenues related to a multi-year digital distribution agreement for Hasbro Studios programming as
well as slightly higher net revenues from the Company’s consumer product and digital gaming licensing groups
were only partially offset by lower net revenues from Backflip.
2014 versus 2013
Entertainment and Licensing segment net revenues increased 15% in 2014 compared to 2013. The increase
in net revenues in 2014 compared to 2013 were primarily related to higher consumer products licensing revenue,
along with contributions from digital gaming and a full year of net revenues from Backflip, of which a 70%
interest was acquired during the third quarter of 2013. Partially offsetting these increases was lower television
programming and film revenue. Higher royalty income included growth in TRANSFORMERS and MY LITTLE
PONY.
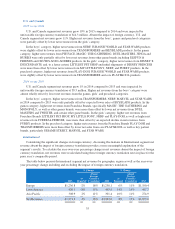
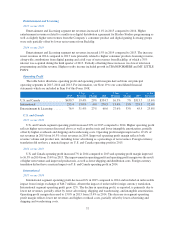
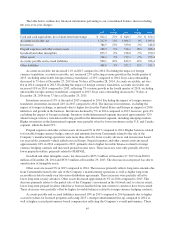
Operating Profit
The table below illustrates operating profit and operating profit margins derived from our principal
operating segments in 2015, 2014 and 2013. For information, see Note 19 to our consolidated financial
statements which are included in Item 8 of this Form 10-K.
2015
% Net
Revenues
%
Change 2014
% Net
Revenues
%
Change 2013
% Net
Revenues
U.S. and Canada ............... $430.7 19.4% 29% $334.7 16.5% 7% $313.7 15.6%
International .................. 255.4 13.0% -6% 270.5 13.4% 15% 235.5 12.6%
Entertainment & Licensing ...... 76.9 31.4% 27% 60.6 27.6% 33% 45.5 23.8%
U.S. and Canada
2015 versus 2014
U.S. and Canada segment operating profit increased 29% in 2015 compared to 2014. Higher operating profit
reflects higher net revenues discussed above as well as product mix and lower intangible amortization, partially
offset by higher overheads and shipping and warehousing costs. Operating profit margin improved to 19.4% of
net revenues in 2015 from 16.5% of net revenues in 2014. Improved operating profit margin reflects both
revenue volume and product mix, including lower advertising as a percentage of net revenues. Foreign currency
translation did not have a material impact on U.S. and Canada operating profit in 2015.
2014 versus 2013
U.S. and Canada operating profit increased 7% in 2014 compared to 2013 and operating profit margin improved
to 16.5% in 2014 from 15.6% in 2013. The improvement in operating profit and operating profit margin was the result
of higher net revenues and improved product mix, as well as lower shipping and distribution costs. Foreign currency
translation did not have a material impact on U.S. and Canada operating profit in 2014.
International
2015 versus 2014
International segment operating profit decreased 6% in 2015 compared to 2014 and included an unfavorable
impact from foreign exchange of $46.7 million. Absent the impact of unfavorable foreign currency translation,
International segment operating profit grew 12%. The decline in operating profit, as reported, is primarily due to
lower net revenues, partially offset by lower advertising, shipping and warehousing, and intangible amortization.
Operating profit margin decreased to 13.0% in 2015 from 13.4% in 2014. The decrease in segment operating
profit margin reflects lower net revenues and higher overhead costs, partially offset by lower advertising and
shipping and warehousing costs.
37