Hasbro 2015 Annual Report Download - page 107
Download and view the complete annual report
Please find page 107 of the 2015 Hasbro annual report below. You can navigate through the pages in the report by either clicking on the pages listed below, or by using the keyword search tool below to find specific information within the annual report.-
 1
1 -
2
-
3
-
4
-
5
-
6
-
7
-
8
-
9
-
10
-
11
-
12
-
13
-
14
-
15
-
16
-
17
-
18
-
19
-
20
-
21
-
22
-
23
-
24
-
25
-
26
-
27
-
28
-
29
-
30
-
31
-
32
-
33
-
34
-
35
-
36
-
37
-
38
-
39
-
40
-
41
-
42
-
43
-
44
-
45
-
46
-
47
-
48
-
49
-
50
-
51
-
52
-
53
-
54
-
55
-
56
-
57
-
58
-
59
-
60
-
61
-
62
-
63
-
64
-
65
-
66
-
67
-
68
-
69
-
70
-
71
-
72
-
73
-
74
-
75
-
76
-
77
-
78
-
79
-
80
-
81
-
82
-
83
-
84
-
85
-
86
-
87
-
88
-
89
-
90
-
91
-
92
-
93
-
94
-
95
-
96
-
 97
97 -
 98
98 -
 99
99 -
 100
100 -
 101
101 -
 102
102 -
 103
103 -
 104
104 -
 105
105 -
 106
106 -
 107
107 -
 108
108 -
 109
109 -
 110
110 -
 111
111 -
 112
112 -
 113
113 -
 114
114 -
 115
115 -
 116
116 -
 117
117 -
118
-
119
-
120
-
121
-
122
-
123
-
124
-
125
-
126
 |
 |

HASBRO, INC. AND SUBSIDIARIES
Notes to Consolidated Financial Statements — (Continued)
(Thousands of Dollars and Shares Except Per Share Data)
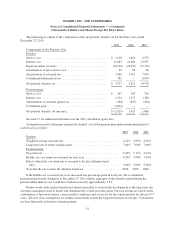
may, provided the other party meets their contractual commitment, be required to pay amounts as follows: 2016:
$43,585; 2017: $64,633; 2018: $62,337; 2019: $56,209; 2020: $16,709; and thereafter: $13,015. At
December 27, 2015, the Company had $124,360 of prepaid royalties, $47,519 of which are included in prepaid
expenses and other current assets and $76,841 of which are included in other assets.
In addition to the above commitments, certain of the above contracts impose minimum marketing
commitments on the Company. The Company may be subject to additional royalty guarantees totaling $170,000
that are not included in the amounts above that may be payable during the next five years contingent upon the
quantity and types of theatrical movie releases by the licensor.
In connection with the Company’s agreement to form a joint venture with Discovery, the Company is
obligated to make future payments to Discovery under a tax sharing agreement. The Company estimates these
payments may total approximately $84,800 and may range from approximately $6,400 to $8,000 per year during
the period 2016 to 2020, and approximately $49,100 in aggregate for all years occurring thereafter. These
payments are contingent upon the Company having sufficient taxable income to realize the expected tax
deductions of certain amounts related to the joint venture.
In connection with the Company’s purchase of a majority stake in Backflip, the Company may be required
to purchase the remaining 30% in the future contingent on the achievement by Backflip of certain predetermined
financial performance metrics. The Company does not know the ultimate timing that these predetermined
financial performance metrics may be met and, thereby, cannot currently estimate the purchase price of the
remaining 30%. See note 1 for additional discussion.
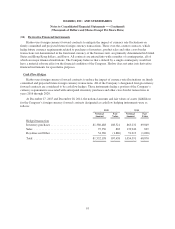
At December 27, 2015, the Company estimates payments related to inventory and tooling purchase
commitments may total approximately $920,500, including contractual commitments under the manufacturing
agreement with Cartamundi as follows: 2016: $119,472; 2017: $113,376; 2018: $107,279; 2019: $101,183; and
2020: $80,144. For additional information about these commitments, see note 17.
Hasbro is party to certain legal proceedings, as well as certain asserted and unasserted claims. Amounts
accrued, as well as the total amount of reasonably possible losses with respect to such matters, individually and
in the aggregate, are not deemed to be material to the consolidated financial statements.
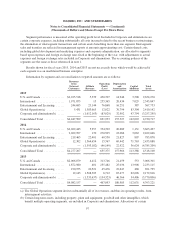
(19) Segment Reporting
Segment and Geographic Information
Hasbro is a worldwide leader in children’s and family leisure time products and services with a broad
portfolio of brands and entertainment properties marketed across toys, games and licensed products ranging from
traditional to high-tech and digital, and film and television entertainment. The Company’s segments are (i) U.S.
and Canada, (ii) International, (iii) Entertainment and Licensing, and (iv) Global Operations.
The U.S. and Canada segment includes the marketing and selling of action figures, arts and crafts and
creative play products, electronic toys and related electronic interactive products, fashion and other dolls, infant
products, play sets, preschool toys, plush products, sports action blasters and accessories, vehicles and toy-related
specialty products, as well as traditional board games and puzzles, and trading card and role-playing games
primarily within the United States and Canada. Within the International segment, the Company markets and sells
both toy and game products in markets outside of the U.S. and Canada, primarily in the European, Asia Pacific,
and Latin and South American regions. The Company’s Entertainment and Licensing segment includes the
Company’s lifestyle licensing, digital gaming, movie and television entertainment operations. The Global
Operations segment is responsible for manufacturing and sourcing finished products for the Company’s U.S. and
Canada and International segments. During the third quarter of 2015, the Company sold its remaining
manufacturing operations in East Longmeadow, Massachusetts and Waterford, Ireland.
96