Hasbro 2015 Annual Report Download - page 56
Download and view the complete annual report
Please find page 56 of the 2015 Hasbro annual report below. You can navigate through the pages in the report by either clicking on the pages listed below, or by using the keyword search tool below to find specific information within the annual report.-
 1
1 -
2
-
3
-
4
-
5
-
6
-
7
-
8
-
9
-
10
-
11
-
12
-
13
-
14
-
15
-
16
-
17
-
18
-
19
-
20
-
21
-
22
-
23
-
24
-
25
-
26
-
27
-
28
-
29
-
30
-
31
-
32
-
33
-
34
-
35
-
36
-
37
-
38
-
39
-
40
-
41
-
42
-
43
-
44
-
45
-
 46
46 -
 47
47 -
 48
48 -
 49
49 -
 50
50 -
 51
51 -
 52
52 -
 53
53 -
 54
54 -
 55
55 -
 56
56 -
 57
57 -
 58
58 -
 59
59 -
 60
60 -
 61
61 -
 62
62 -
 63
63 -
 64
64 -
 65
65 -
 66
66 -
67
-
68
-
69
-
70
-
71
-
72
-
73
-
74
-
75
-
76
-
77
-
78
-
79
-
80
-
81
-
82
-
83
-
84
-
85
-
86
-
87
-
88
-
89
-
90
-
91
-
92
-
93
-
94
-
95
-
96
-
97
-
98
-
99
-
100
-
101
-
102
-
103
-
104
-
105
-
106
-
107
-
108
-
109
-
110
-
111
-
112
-
113
-
114
-
115
-
116
-
117
-
118
-
119
-
120
-
121
-
122
-
123
-
124
-
125
-
126
 |
 |

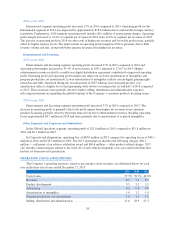
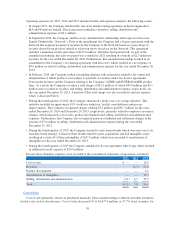
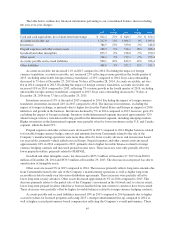
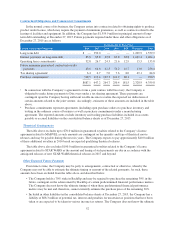
The table below outlines key financial information pertaining to our consolidated balance sheets including
the year-over-year changes.
2015
%
Change 2014
%
Change 2013
Cash and cash equivalents, net of short-term borrowings .... $ 812.2 27% $ 640.7 -5% $ 674.1
Accounts receivable, net ............................. 1,217.9 11% 1,094.7 0% 1,093.6
Inventories ........................................ 384.5 13% 339.6 -3% 348.8
Prepaid expenses and other current assets ................ 286.5 -9% 316.1 18% 268.4
Goodwill and other intangibles ........................ 873.5 -5% 918.0 -5% 970.3
Other assets ....................................... 744.1 3% 719.1 -9% 793.4
Accounts payable and accrued liabilities ................. 900.1 10% 819.2 -12% 926.4
Other liabilities ..................................... 404.9 3% 392.2 12% 351.3
Accounts receivable, net increased 11% in 2015 compared to 2014. Excluding the impact of foreign
currency translation, accounts receivable, net, increased 23% reflecting revenue growth in the fourth quarter of
2015, excluding unfavorable foreign currency translation, of 23% compared to 2014. Days sales outstanding
decreased to 75 days at December 27, 2015 from 76 days at December 28, 2014. Accounts receivable, net was
flat in 2014 compared to 2013. Excluding the impact of foreign currency translation, accounts receivable, net
increased 10% in 2014 compared to 2013, reflecting 7% revenue growth in the fourth quarter of 2014, excluding
unfavorable foreign currency translation, compared to 2013. Days sales outstanding decreased to 76 days at
December 28, 2014 from 77 days at December 29, 2013.
Inventories increased 13% at the end of 2015 compared to 2014. Excluding the impact of foreign currency
translation, inventories increased 24% in 2015 compared to 2014. The increase in inventories, excluding the
impact of foreign exchange, is primarily due to higher levels in the United States and Europe in support of 2016
initiatives and growth in the business. Inventories declined by 3% in 2014 compared to 2013, however, grew 8%
excluding the impact of foreign exchange. Inventory in the International segment increased approximately 32%
absent foreign currency translation reflecting growth in the International segment, including emerging markets.
Higher inventories in the International segment were partially offset by lower inventories in the U.S. and Canada
segment, which declined 23%.
Prepaid expenses and other current assets decreased 9% in 2015 compared to 2014. Higher balances related
to favorable foreign currency hedge contracts and amounts due from Cartamundi related to the sale of the
Company’s manufacturing operations were more than offset by lower royalty advances and non-income based
tax receivables, primarily valued added taxes in Europe. Prepaid expenses and other current assets increased
approximately 18% in 2014 compared to 2013, primarily due to higher favorable balances related to foreign
currency hedging contracts and increased prepaid income taxes. These increases were only partially offset by
lower prepaid royalties, primarily related to MARVEL.
Goodwill and other intangible assets, net decreased to $873.5 million at December 27, 2015 from $918.0
million at December 28, 2014 and $970.3 million at December 29, 2013. The decrease in each period was due to
amortization of intangible assets.
Other assets increased 3% in 2015 compared to 2014. The increase primarily reflects long-term amounts due
from Cartamundi related to the sale of the Company’s manufacturing operations as well as higher long-term
receivables related to multi-year television distribution agreements. These increases were partially offset by
lower long-term royalty advances. Other assets decreased approximately 9% in 2014 compared to 2013. This
decrease primarily relates to the partial sale of the Company’s investment in the Network and, to a lesser extent,
lower long-term prepaid royalties which have been reclassified from non-current to current or have been earned.
These decreases were partially offset by higher favorable balances related to foreign currency hedging contracts.
Accounts payable and accrued liabilities increased 10% in 2015 compared to 2014 primarily due to higher
accrued royalties for licensed properties reflecting 2015’s stronger entertainment line-up compared to 2014 as
well as higher accrued performance-based compensation reflecting the Company’s overall performance. These
45