Hasbro 2015 Annual Report Download - page 47
Download and view the complete annual report
Please find page 47 of the 2015 Hasbro annual report below. You can navigate through the pages in the report by either clicking on the pages listed below, or by using the keyword search tool below to find specific information within the annual report.-
 1
1 -
2
-
3
-
4
-
5
-
6
-
7
-
8
-
9
-
10
-
11
-
12
-
13
-
14
-
15
-
16
-
17
-
18
-
19
-
20
-
21
-
22
-
23
-
24
-
25
-
26
-
27
-
28
-
29
-
30
-
31
-
32
-
33
-
34
-
35
-
36
-
 37
37 -
 38
38 -
 39
39 -
 40
40 -
 41
41 -
 42
42 -
 43
43 -
 44
44 -
 45
45 -
 46
46 -
 47
47 -
 48
48 -
 49
49 -
 50
50 -
 51
51 -
 52
52 -
 53
53 -
 54
54 -
 55
55 -
 56
56 -
 57
57 -
58
-
59
-
60
-
61
-
62
-
63
-
64
-
65
-
66
-
67
-
68
-
69
-
70
-
71
-
72
-
73
-
74
-
75
-
76
-
77
-
78
-
79
-
80
-
81
-
82
-
83
-
84
-
85
-
86
-
87
-
88
-
89
-
90
-
91
-
92
-
93
-
94
-
95
-
96
-
97
-
98
-
99
-
100
-
101
-
102
-
103
-
104
-
105
-
106
-
107
-
108
-
109
-
110
-
111
-
112
-
113
-
114
-
115
-
116
-
117
-
118
-
119
-
120
-
121
-
122
-
123
-
124
-
125
-
126
 |
 |
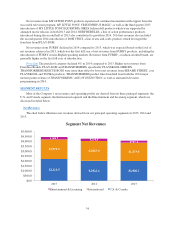
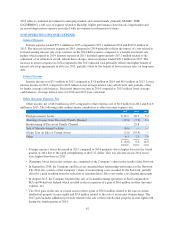
2015 versus 2014
International segment net revenues declined approximately 3% in 2015 compared to 2014. Net revenues
grew in certain developed markets, including the United Kingdom and Germany; however, this was offset by
declines in other markets. Emerging markets, including Russia, Brazil and China, net revenues declined 9% in
2015 compared to 2014. 2015 International segment net revenues included unfavorable foreign currency
translation of $379.4 million (Europe — $247.9 million, Latin America — $105.3 million, Asia Pacific — $26.2
million). Unfavorable foreign currency translation reflects the weakening of certain foreign currencies, primarily
the Euro, Russian Ruble, Brazilian Real, and other Latin American currencies compared to the U.S. dollar.
Absent the impact of foreign currency translation, International segment net revenues grew 16% in 2015
compared to 2014. In 2015 excluding the impact of foreign exchange, net revenues grew 15% in emerging
markets.
Higher net revenues from the boys’ and preschool categories were offset by lower net revenues from the
girls’ and games category.
In the boys’ category, higher net revenues from Franchise Brand NERF and Partner Brands JURASSIC
WORLD, MARVEL and STAR WARS were slightly offset by expected lower net revenues from
TRANSFORMERS products, which, in 2014, were supported by a major theatrical release. In the games
category, higher net revenues from Franchise Brand MONOPOLY as well as higher net revenues from certain
other games brands, including PIE FACE was more than offset by lower revenues from Franchise Brand
MAGIC: THE GATHERING and various other game brands. In the girls’ category, higher net revenues from
Franchise Brand PLAY-DOH and the introduction of Partner Brand DISNEY DESCENDANTS were more than
offset by expected lower net revenues from FURBY products, as well as declines in MY LITTLE PONY
products. In the preschool category, higher net revenues from Franchise Brand PLAY-DOH and Partner Brand
JURASSIC WORLD, as well as the introduction of PLAYSKOOL FRIENDS MY LITTLE PONY, were only
slightly offset by lower net revenues from core PLAYSKOOL and TONKA products.
2014 versus 2013
International segment net revenues grew approximately 8% in 2014 compared to 2013. International
segment net revenues included unfavorable foreign currency translation of $87.7 million (Europe — $61.2
million, Latin America — $21.5 million, Asia Pacific — $5.0 million) in 2014. Unfavorable foreign currency
translation reflects the weakening of certain foreign currencies, primarily the Euro, Russian Ruble, Brazilian
Real, and other Latin American currencies compared to the U.S. dollar. Absent the impact of foreign currency
translation, International segment net revenues grew 13% in 2014 compared to 2013. In 2014, net revenues grew
in certain developed markets, including the United Kingdom, Italy and Spain, partially offset by lower net
revenues in France. Furthermore, net revenues from emerging markets, including, but not limited to, Russia,
Brazil and China, increased 20% in 2014 compared to 2013.
Higher net revenues in 2014 from the boys’, girls’, and preschool categories were partially offset by lower
net revenues from the games category.
In the boys’ category, higher net revenues from TRANSFORMERS, MARVEL and NERF products were
only partially offset by expected lower sales of BEYBLADE products. In the games category, growth in
Franchise Brands, specifically MAGIC: THE GATHERING and MONOPOLY, were more than offset by lower
net revenues from ANGRY BIRDS, TWISTER and certain other game brands. In the girls’ category, Franchise
Brands MY LITTLE PONY, NERF and PLAY-DOH contributed to growth that was only partially offset by
lower net revenues from FURBY and LITTLEST PET SHOP products. In the preschool category, higher net
revenues from Franchise Brands PLAY-DOH and TRANSFORMERS were only partially offset by lower net
revenues from core PLAYSKOOL products.
36