Hasbro 2015 Annual Report Download - page 71
Download and view the complete annual report
Please find page 71 of the 2015 Hasbro annual report below. You can navigate through the pages in the report by either clicking on the pages listed below, or by using the keyword search tool below to find specific information within the annual report.-
 1
1 -
2
-
3
-
4
-
5
-
6
-
7
-
8
-
9
-
10
-
11
-
12
-
13
-
14
-
15
-
16
-
17
-
18
-
19
-
20
-
21
-
22
-
23
-
24
-
25
-
26
-
27
-
28
-
29
-
30
-
31
-
32
-
33
-
34
-
35
-
36
-
37
-
38
-
39
-
40
-
41
-
42
-
43
-
44
-
45
-
46
-
47
-
48
-
49
-
50
-
51
-
52
-
53
-
54
-
55
-
56
-
57
-
58
-
59
-
60
-
 61
61 -
 62
62 -
 63
63 -
 64
64 -
 65
65 -
 66
66 -
 67
67 -
 68
68 -
 69
69 -
 70
70 -
 71
71 -
 72
72 -
 73
73 -
 74
74 -
 75
75 -
 76
76 -
 77
77 -
 78
78 -
 79
79 -
 80
80 -
 81
81 -
82
-
83
-
84
-
85
-
86
-
87
-
88
-
89
-
90
-
91
-
92
-
93
-
94
-
95
-
96
-
97
-
98
-
99
-
100
-
101
-
102
-
103
-
104
-
105
-
106
-
107
-
108
-
109
-
110
-
111
-
112
-
113
-
114
-
115
-
116
-
117
-
118
-
119
-
120
-
121
-
122
-
123
-
124
-
125
-
126
 |
 |

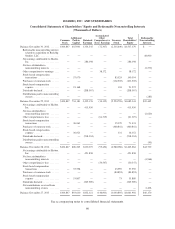
HASBRO, INC. AND SUBSIDIARIES
Consolidated Statements of Shareholders’ Equity and Redeemable Noncontrolling Interests
(Thousands of Dollars)
Common
Stock
Additional
Paid-in
Capital
Retained
Earnings
Accumulated
Other
Comprehensive
(Loss) Earnings
Treasury
Stock
Total
Shareholders’
Equity
Redeemable
Noncontrolling
Interests
Balance, December 30, 2012 ....... $104,847 655,943 3,354,545 (72,307) (2,535,649) $1,507,379 $ —
Redeemable noncontrolling interest
related to acquisition of Backflip
Studios, LLC ................ — — — — — — 48,000
Net earnings attributable to Hasbro,
Inc. ....................... — — 286,198 — — 286,198 —
Net loss attributable to
noncontrolling interests ....... — — — — — — (2,270)
Other comprehensive earnings .... — — — 38,172 — 38,172 —
Stock-based compensation
transactions ................. — 57,070 — — 83,324 140,394 —
Purchases of common stock ...... — — — — (102,505) (102,505) —
Stock-based compensation
expense ....................
— 21,168 — — 104 21,272 —
Dividends declared ............. — — (208,567) — — (208,567) —
Distributions paid to noncontrolling
owners ..................... — — — — — — (285)
Balance, December 29, 2013 ....... $104,847 734,181 3,432,176 (34,135) (2,554,726) $1,682,343 $45,445
Net earnings attributable to Hasbro,
Inc. ....................... — — 415,930 — — 415,930 —
Net loss attributable to
noncontrolling interests ....... — — — — — — (2,620)
Other comprehensive loss ........ — — — (61,319) — (61,319) —
Stock-based compensation
transactions .................
— 36,063 — — 35,370 71,433 —
Purchases of common stock ...... — — — — (460,841) (460,841) —
Stock-based compensation
expense .................... — 36,021 — — 131 36,152 —
Dividends declared ............. — — (218,034) — — (218,034) —
Distributions paid to noncontrolling
owners ..................... — — — — — — (95)
Balance, December 28, 2014 ....... $104,847 806,265 3,630,072 (95,454) (2,980,066) $1,465,664 $42,730
Net earnings attributable to Hasbro,
Inc. ....................... — — 451,838 — — 451,838 —
Net loss attributable to
noncontrolling interests ....... — — — — — — (4,966)
Other comprehensive loss ........ — — — (50,547) — (50,547) —
Stock-based compensation
transactions .................
— 33,558 — — 23,992 57,550 —
Purchases of common stock ...... — — — — (84,894) (84,894) —
Stock-based compensation
expense ....................
— 53,807 — — 73 53,880 —
Dividends declared ............. — — (229,589) — — (229,589) —
Net contributions received from
noncontrolling owners ........ — — — — — — 2,406
Balance, December 27, 2015 ....... $104,847 893,630 3,852,321 (146,001) (3,040,895) $1,663,902 $40,170
See accompanying notes to consolidated financial statements.
60