Hasbro 2015 Annual Report Download - page 46
Download and view the complete annual report
Please find page 46 of the 2015 Hasbro annual report below. You can navigate through the pages in the report by either clicking on the pages listed below, or by using the keyword search tool below to find specific information within the annual report.-
 1
1 -
2
-
3
-
4
-
5
-
6
-
7
-
8
-
9
-
10
-
11
-
12
-
13
-
14
-
15
-
16
-
17
-
18
-
19
-
20
-
21
-
22
-
23
-
24
-
25
-
26
-
27
-
28
-
29
-
30
-
31
-
32
-
33
-
34
-
35
-
 36
36 -
 37
37 -
 38
38 -
 39
39 -
 40
40 -
 41
41 -
 42
42 -
 43
43 -
 44
44 -
 45
45 -
 46
46 -
 47
47 -
 48
48 -
 49
49 -
 50
50 -
 51
51 -
 52
52 -
 53
53 -
 54
54 -
 55
55 -
 56
56 -
57
-
58
-
59
-
60
-
61
-
62
-
63
-
64
-
65
-
66
-
67
-
68
-
69
-
70
-
71
-
72
-
73
-
74
-
75
-
76
-
77
-
78
-
79
-
80
-
81
-
82
-
83
-
84
-
85
-
86
-
87
-
88
-
89
-
90
-
91
-
92
-
93
-
94
-
95
-
96
-
97
-
98
-
99
-
100
-
101
-
102
-
103
-
104
-
105
-
106
-
107
-
108
-
109
-
110
-
111
-
112
-
113
-
114
-
115
-
116
-
117
-
118
-
119
-
120
-
121
-
122
-
123
-
124
-
125
-
126
 |
 |

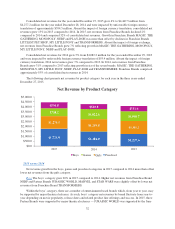
U.S. and Canada
2015 versus 2014
U.S. and Canada segment net revenues grew 10% in 2015 compared to 2014 and were impacted by
unfavorable foreign currency translation of $14.3 million. Absent the impact of foreign currency, U.S. and
Canada segment net revenues grew 11%. Higher net revenues from the boys’, games and preschool categories
were partially offset by lower net revenues from the girls’ category.
In the boys’ category, higher net revenues from NERF, JURASSIC WORLD and STAR WARS products
were slightly offset by lower net revenues from TRANSFORMERS and BEYBLADE products. In the games
category, higher net revenues from PIE FACE, MAGIC: THE GATHERING, DUEL MASTERS, JENGA and
RUBIKS were only partially offset by lower net revenues from other game brands including ELEFUN &
FRIENDS and CHUTES AND LADDERS products. In the girls’ category, higher net revenues from DISNEY’S
DESCENDANTS, and, to a lesser extent, LITTLEST PET SHOP and initial shipments of DISNEY PRINCESS
were more than offset by lower net revenues from MY LITTLE PONY, NERF, and FURBY products. In the
preschool category, higher net revenues from PLAY-DOH, JURASSIC WORLD and STAR WARS products
were slightly offset by lower net revenues from TRANSFORMERS and core PLAYSKOOL products.
2014 versus 2013
U.S. and Canada segment net revenues grew 1% in 2014 compared to 2013 and were impacted by
unfavorable foreign currency translation of $5.5 million. Higher net revenues from the boys’ category were
almost wholly offset by lower net revenues from the games, girls’ and preschool categories.
In the boys’ category, higher net revenues from TRANSFORMERS, NERF, MARVEL and STAR WARS
in 2014 compared to 2013 were only partially offset by expected lower sales of BEYBLADE products. In the
games category, higher net revenues from Franchise Brands, specifically MAGIC: THE GATHERING and
MONOPOLY, as well as other games brands, were more than offset by lower net revenues from DUEL
MASTERS and TWISTER, and certain other game brands. In the girls’ category, higher net revenues from
Franchise Brands LITTLEST PET SHOP, MY LITTLE PONY, NERF and PLAY-DOH, as well as higher net
revenues from FURREAL FRIENDS, were more than offset by an expected decline in net revenues from
FURBY products. In the preschool category, higher net revenues from the Franchise Brands PLAY-DOH and
TRANSFORMERS were more than offset by lower net sales from core PLAYSKOOL as well as key partner
brands, particularly SESAME STREET, MARVEL and STAR WARS.
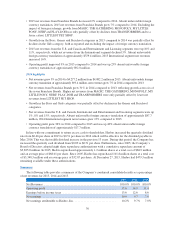
International
Considering the significant changes in foreign currency, discussing fluctuations in International segment net
revenue absent the impact of foreign currency translation provides a more meaningful explanation of the
segment’s results. To calculate the year-over-year percentage change in net revenues absent the impact of foreign
currency translation, net revenues were recalculated using those foreign currency translation rates in place for the
prior year’s comparable period.
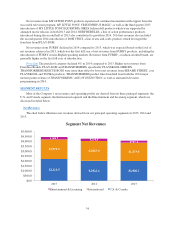
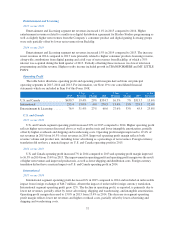
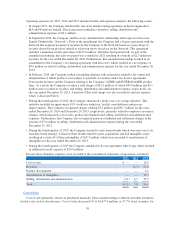
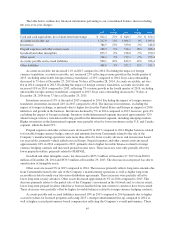
The table below presents International segment net revenues by geographic region as well as the year-over-
year percentage change including and excluding the impact of foreign currency translation.
2015
% Change % Change
As
Reported
Absent
Foreign
Currency
Translation 2014
As
Reported
Absent
Foreign
Currency
Translation 2013
Europe ................... $1,236.8 -2% 18% $1,258.1 6% 11% $1,190.4
Latin America ............. 426.1 -8% 15% 463.5 14% 19% 407.7
Asia Pacific ............... 308.9 2% 11% 301.4 10% 11% 274.9
Net Revenues ............. $1,971.9 -3% 16% $2,023.0 8% 13% $1,873.0
35