Hasbro 2015 Annual Report Download - page 39
Download and view the complete annual report
Please find page 39 of the 2015 Hasbro annual report below. You can navigate through the pages in the report by either clicking on the pages listed below, or by using the keyword search tool below to find specific information within the annual report.-
 1
1 -
2
-
3
-
4
-
5
-
6
-
7
-
8
-
9
-
10
-
11
-
12
-
13
-
14
-
15
-
16
-
17
-
18
-
19
-
20
-
21
-
22
-
23
-
24
-
25
-
26
-
27
-
28
-
 29
29 -
 30
30 -
 31
31 -
 32
32 -
 33
33 -
 34
34 -
 35
35 -
 36
36 -
 37
37 -
 38
38 -
 39
39 -
 40
40 -
 41
41 -
 42
42 -
 43
43 -
 44
44 -
 45
45 -
 46
46 -
 47
47 -
 48
48 -
 49
49 -
50
-
51
-
52
-
53
-
54
-
55
-
56
-
57
-
58
-
59
-
60
-
61
-
62
-
63
-
64
-
65
-
66
-
67
-
68
-
69
-
70
-
71
-
72
-
73
-
74
-
75
-
76
-
77
-
78
-
79
-
80
-
81
-
82
-
83
-
84
-
85
-
86
-
87
-
88
-
89
-
90
-
91
-
92
-
93
-
94
-
95
-
96
-
97
-
98
-
99
-
100
-
101
-
102
-
103
-
104
-
105
-
106
-
107
-
108
-
109
-
110
-
111
-
112
-
113
-
114
-
115
-
116
-
117
-
118
-
119
-
120
-
121
-
122
-
123
-
124
-
125
-
126
 |
 |
time, subject to market conditions. These shares may be repurchased in the open market or through privately
negotiated transactions. The Company has no obligation to repurchase shares under the authorization, and the
timing, actual number, and value of the shares that are repurchased, if any, will depend on a number of factors,
including the price of the Company’s stock. The Company may suspend or discontinue the program at any time
and there is no expiration date.
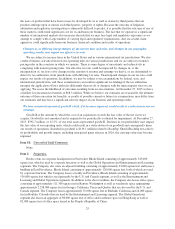
Item 6. Selected Financial Data.
(Thousands of dollars and shares except per share data and ratios)
Fiscal Year
2015 2014 2013 2012 2011
Consolidated Statements of Operations Data:
Net revenues ........................... $4,447,509 4,277,207 4,082,157 4,088,983 4,285,589
Operating Profit ......................... $ 691,933 635,375 467,093 551,785 593,981
Net earnings ............................ $ 446,872 413,310 283,928 335,999 385,367
Net loss attributable to noncontrolling
interests ............................. $ (4,966) (2,620) (2,270) — —
Net earnings attributable to Hasbro, Inc. ..... $ 451,838 415,930 286,198 335,999 385,367
Per Common Share Data:
Net Earnings Attributable to Hasbro, Inc.
Basic ............................... $ 3.61 3.24 2.20 2.58 2.88
Diluted .............................. $ 3.57 3.20 2.17 2.55 2.82
Cash dividends declared .................. $ 1.84 1.72 1.60 1.44 1.20
Consolidated Balance Sheets Data:
Total assets ............................ $4,720,717 4,518,100 4,393,221 4,315,134 4,119,056
Total long-term debt(1) ................... $1,559,895 1,559,895 1,388,285 1,396,421 1,400,872
Ratio of Earnings to Fixed Charges(2) ......... 6.52 6.05 3.94 5.31 5.71
Weighted Average Number of Common Shares:
Basic ................................. 125,006 128,411 130,186 130,067 133,823
Diluted ................................ 126,688 129,886 131,788 131,926 136,697
(1) Represents principal balance of long-term debt and related fair value adjustments. Excludes related deferred
debt expenses.
(2) For purposes of calculating the ratio of earnings to fixed charges, fixed charges include interest expense and
one-third of rentals; earnings available for fixed charges represent earnings before income taxes, less the
Company’s share of earnings (losses) from equity investees plus fixed charges.
See “Forward-Looking Information and Risk Factors That May Affect Future Results” contained in Item 1A of
this report for a discussion of risks and uncertainties that may affect future results. Also see “Management’s
Discussion and Analysis of Financial Condition and Results of Operations” contained in Item 7 of this report for
a discussion of factors affecting the comparability of information contained in this Item 6.
28