Hasbro 2015 Annual Report Download - page 68
Download and view the complete annual report
Please find page 68 of the 2015 Hasbro annual report below. You can navigate through the pages in the report by either clicking on the pages listed below, or by using the keyword search tool below to find specific information within the annual report.-
 1
1 -
2
-
3
-
4
-
5
-
6
-
7
-
8
-
9
-
10
-
11
-
12
-
13
-
14
-
15
-
16
-
17
-
18
-
19
-
20
-
21
-
22
-
23
-
24
-
25
-
26
-
27
-
28
-
29
-
30
-
31
-
32
-
33
-
34
-
35
-
36
-
37
-
38
-
39
-
40
-
41
-
42
-
43
-
44
-
45
-
46
-
47
-
48
-
49
-
50
-
51
-
52
-
53
-
54
-
55
-
56
-
57
-
 58
58 -
 59
59 -
 60
60 -
 61
61 -
 62
62 -
 63
63 -
 64
64 -
 65
65 -
 66
66 -
 67
67 -
 68
68 -
 69
69 -
 70
70 -
 71
71 -
 72
72 -
 73
73 -
 74
74 -
 75
75 -
 76
76 -
 77
77 -
 78
78 -
79
-
80
-
81
-
82
-
83
-
84
-
85
-
86
-
87
-
88
-
89
-
90
-
91
-
92
-
93
-
94
-
95
-
96
-
97
-
98
-
99
-
100
-
101
-
102
-
103
-
104
-
105
-
106
-
107
-
108
-
109
-
110
-
111
-
112
-
113
-
114
-
115
-
116
-
117
-
118
-
119
-
120
-
121
-
122
-
123
-
124
-
125
-
126
 |
 |

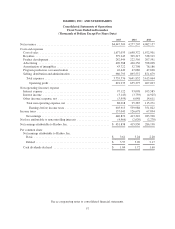
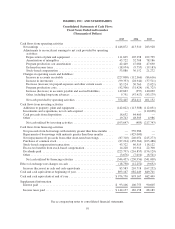
HASBRO, INC. AND SUBSIDIARIES
Consolidated Statements of Operations
Fiscal Years Ended in December
(Thousands of Dollars Except Per Share Data)
2015 2014 2013
Net revenues ................................................. $4,447,509 4,277,207 4,082,157
Costs and expenses
Cost of sales ............................................... 1,677,033 1,698,372 1,672,901
Royalties .................................................. 379,245 305,317 338,919
Product development ......................................... 242,944 222,556 207,591
Advertising ................................................ 409,388 420,256 398,098
Amortization of intangibles .................................... 43,722 52,708 78,186
Program production cost amortization ........................... 42,449 47,086 47,690
Selling, distribution and administration .......................... 960,795 895,537 871,679
Total expenses ............................................ 3,755,576 3,641,832 3,615,064
Operating profit ......................................... 691,933 635,375 467,093
Non-operating (income) expense
Interest expense ............................................. 97,122 93,098 105,585
Interest income ............................................. (3,145) (3,759) (4,925)
Other (income) expense, net ................................... (5,959) 6,048 14,611
Total non-operating expense, net ............................. 88,018 95,387 115,271
Earnings before income taxes .............................. 603,915 539,988 351,822
Income taxes ................................................. 157,043 126,678 67,894
Net earnings .............................................. 446,872 413,310 283,928
Net loss attributable to noncontrolling interests ...................... (4,966) (2,620) (2,270)
Net earnings attributable to Hasbro, Inc. ........................... $ 451,838 415,930 286,198
Per common share
Net earnings attributable to Hasbro, Inc.
Basic ................................................... $ 3.61 3.24 2.20
Diluted .................................................. $ 3.57 3.20 2.17
Cash dividends declared ...................................... $ 1.84 1.72 1.60
See accompanying notes to consolidated financial statements.
57