Hasbro 2015 Annual Report Download - page 51
Download and view the complete annual report
Please find page 51 of the 2015 Hasbro annual report below. You can navigate through the pages in the report by either clicking on the pages listed below, or by using the keyword search tool below to find specific information within the annual report.-
 1
1 -
2
-
3
-
4
-
5
-
6
-
7
-
8
-
9
-
10
-
11
-
12
-
13
-
14
-
15
-
16
-
17
-
18
-
19
-
20
-
21
-
22
-
23
-
24
-
25
-
26
-
27
-
28
-
29
-
30
-
31
-
32
-
33
-
34
-
35
-
36
-
37
-
38
-
39
-
40
-
 41
41 -
 42
42 -
 43
43 -
 44
44 -
 45
45 -
 46
46 -
 47
47 -
 48
48 -
 49
49 -
 50
50 -
 51
51 -
 52
52 -
 53
53 -
 54
54 -
 55
55 -
 56
56 -
 57
57 -
 58
58 -
 59
59 -
 60
60 -
 61
61 -
62
-
63
-
64
-
65
-
66
-
67
-
68
-
69
-
70
-
71
-
72
-
73
-
74
-
75
-
76
-
77
-
78
-
79
-
80
-
81
-
82
-
83
-
84
-
85
-
86
-
87
-
88
-
89
-
90
-
91
-
92
-
93
-
94
-
95
-
96
-
97
-
98
-
99
-
100
-
101
-
102
-
103
-
104
-
105
-
106
-
107
-
108
-
109
-
110
-
111
-
112
-
113
-
114
-
115
-
116
-
117
-
118
-
119
-
120
-
121
-
122
-
123
-
124
-
125
-
126
 |
 |

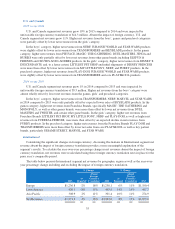
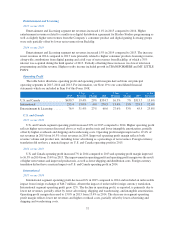
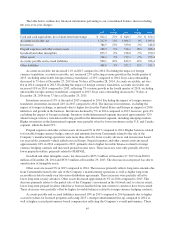
the year ended December 27, 2015 compared to $1,698.4 million, or 39.7% of net revenues, for the year ended
December 28, 2014 despite consolidated net revenue growth of 4%. Lower cost of sales in dollars and as a percent
of net revenues reflects both product and revenue mix. Product mix reflects higher net revenues from royalty-
bearing products which generally carry higher pricing and, therefore, have a lower cost of sales as a percentage of
net revenues. Generally, the lower cost of sales on royalty-bearing products may be partially offset by higher royalty
expense. In 2015, the following entertainment-driven, royalty-bearing brands were supported by major theatrical
releases: JURASSIC WORLD, MARVEL and STAR WARS. Likewise, revenue mix reflects higher net revenue
contributions from the Company’s Entertainment and Licensing segment. In 2015, Entertainment and Licensing
segment net revenues were 5.5% of consolidated net revenues compared to 5.1% in 2014.
In 2014, cost of sales increased in dollars from $1,672.9 million for 2013 to $1,698.4 million in 2014, but
decreased as a percent of net revenues from 41.0% in 2013 to 39.7% in 2014. Absent the impact of
aforementioned charges, cost of sales was $1,662.7 million, or 40.7% of net revenues, for the year ended
December 29, 2013. The cost of sales increase in dollars in 2014 compared to 2013 reflects higher net revenues.
The cost of sales decrease as a percent of net revenues in 2014 compared to 2013 reflects a more favorable
revenue mix and impact from cost savings and efficiencies from the Company’s owned-manufacturing facilities
partially offset by the impact on net revenues of higher sales promotions. In 2014, product mix reflects higher net
revenues from royalty-bearing products which generally carry higher pricing and, therefore, have a lower cost of
sales as a percentage of net revenues, as well as higher net revenues from the high margin Entertainment and
Licensing segment.
Royalty Expense
Royalty expense of $379.2 million, or 8.5% or net revenues, in 2015 compared to $305.3 million, or 7.1% of
net revenues, in 2014 and $338.9 million, or 8.3% of net revenues, in 2013. Excluding the impact of the
arbitration award settlement and amendment of the Zynga agreement summarized above, 2013 royalty expense
was $275.1 million, or 6.7% of net revenues. Fluctuations in royalty expense generally relate to the volume of
entertainment-driven products sold in a given period, especially if there is a major motion picture release.
Product lines related to Hasbro-owned or controlled brands supported by entertainment generally do not incur the
same level of royalty expense as licensed properties, particularly STAR WARS and MARVEL. Higher royalty
expense, in both dollars and as a percentage of net revenues, in 2015 compared to 2014 and 2013 reflect the mix
of entertainment-driven product sold. In particular, higher royalty expense in 2015 compared to 2014 reflects
higher net sales of MARVEL, JURASSIC WORLD and STAR WARS products partially offset by lower net
sales of TRANSFORMERS royalty-bearing movie product in 2015 compared to 2014. Higher royalty expense, in
both dollars and as a percent of net revenues, in 2014 compared to 2013 reflects the strength of the 2014
entertainment line-up compared to 2013, including higher sales of TRANSFORMERS movie products.
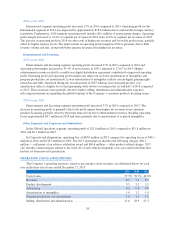
Product Development
Product development expense in 2015 totaled $242.9 million, or 5.5% of net revenues, compared to $222.6
million, or 5.2% of net revenues, in 2014. The increase in product development expense primarily reflects
development costs incurred related to the DISNEY PRINCESS and FROZEN license agreement. These higher
expenses were not offset by related revenues as initial product shipments did not commence until late in the
fourth quarter of 2015 in preparation for the January 1, 2016 retail on-shelf date. Additionally, the Company
continues to incur product development expenses related to the development of a new digital platform for
MAGIC: THE GATHERING and the development of new mobile game offerings by Backflip.
Product development expense in 2014 totaled $222.6 million, or 5.2% of net revenues, compared to $207.6
million, or 5.1% of net revenues, in 2013. Product development expense for 2013 included restructuring charges
of $4.1 million. Excluding the impact of these charges, product development expense was $203.5 million in
2013. The increases in 2014 compared to 2013 primarily reflects the addition of Backflip, as well as continued
investment in certain brands, particularly MAGIC: THE GATHERING. Furthermore, during the fourth quarter of
2014, the Company began to incur development costs related to the DISNEY PRINCESS and FROZEN license
agreement with Disney.
40