Hasbro 2015 Annual Report Download - page 57
Download and view the complete annual report
Please find page 57 of the 2015 Hasbro annual report below. You can navigate through the pages in the report by either clicking on the pages listed below, or by using the keyword search tool below to find specific information within the annual report.-
 1
1 -
2
-
3
-
4
-
5
-
6
-
7
-
8
-
9
-
10
-
11
-
12
-
13
-
14
-
15
-
16
-
17
-
18
-
19
-
20
-
21
-
22
-
23
-
24
-
25
-
26
-
27
-
28
-
29
-
30
-
31
-
32
-
33
-
34
-
35
-
36
-
37
-
38
-
39
-
40
-
41
-
42
-
43
-
44
-
45
-
46
-
 47
47 -
 48
48 -
 49
49 -
 50
50 -
 51
51 -
 52
52 -
 53
53 -
 54
54 -
 55
55 -
 56
56 -
 57
57 -
 58
58 -
 59
59 -
 60
60 -
 61
61 -
 62
62 -
 63
63 -
 64
64 -
 65
65 -
 66
66 -
 67
67 -
68
-
69
-
70
-
71
-
72
-
73
-
74
-
75
-
76
-
77
-
78
-
79
-
80
-
81
-
82
-
83
-
84
-
85
-
86
-
87
-
88
-
89
-
90
-
91
-
92
-
93
-
94
-
95
-
96
-
97
-
98
-
99
-
100
-
101
-
102
-
103
-
104
-
105
-
106
-
107
-
108
-
109
-
110
-
111
-
112
-
113
-
114
-
115
-
116
-
117
-
118
-
119
-
120
-
121
-
122
-
123
-
124
-
125
-
126
 |
 |
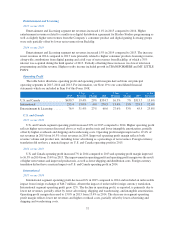
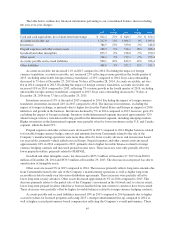
increases were partially offset by lower accrued advertising. Accounts payable and accrued expenses decreased
approximately 12% in 2014 compared to 2013. The decrease was primarily due to lower accrued royalties and
accrued interest, primarily resulting from the payment of amounts accrued at the end of 2013 related to the
settlement of an adverse arbitration award as well as lower accrued severance due to scheduled payments.
Other liabilities increased 3% in 2015 compared to 2014. The increase primarily reflects higher uncertain
tax positions partially offset by a reduction in pension liabilities reflecting changes in actuarial assumptions,
primarily due to higher discount rates. Other liabilities increased 12% in 2014 compared to 2013. The increase
reflects higher pension liabilities primarily due to changes in actuarial assumptions, including lower discount
rates and updated mortality tables. In addition, the amended relationship between the Company and Discovery
resulted in a net increase to other liabilities of approximately $10.7 million reflecting the fair value of an option
agreement related to the Company’s equity interest in the Network, partially offset by a reduction in the amounts
due to Discovery related to a tax sharing agreement. These increases were partially offset by lower liabilities
related to uncertain tax positions reflecting the settlement of tax examinations in 2014 primarily related to the
United States and Mexico. In connection with the settlement of tax assessments and years subject to audit from
2000 through 2013 in Mexico, the Company paid approximately $65.0 million during the fourth quarter of 2014.
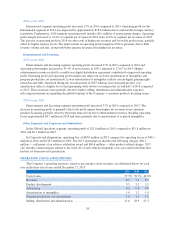
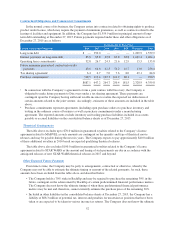
Cash flows utilized by investing activities were $103.6 million, $0.5 million and $217.7 million in 2015,
2014 and 2013, respectively. Additions to property, plant and equipment increased in 2015 to $142.0 million
from $113.4 million and $112.0 in 2014 and 2013, respectively. Of these additions, 54% in 2015, 60% in 2014
and 51% in 2013 were for purchases of tools, dies and molds related to the Company’s products. Absent the
Company’s investment in tools, dies and molds, higher capital expenditures reflect the Company’s investment in
information systems. In 2016, the Company expects capital expenditures to be in the range of $130.0 million to
$160.0 million. During the three years ended December 27, 2015, the depreciation of plant and equipment was
$111.6 million, $105.3 million and $102.8 million, respectively. Fluctuations in depreciation of plant and
equipment correlate with the percentage of additions to property, plant and equipment relating to tools, dies and
molds which have shorter useful lives and accelerated depreciation. Excluding capital expenditures, 2015
proceeds from investing activities reflects $18.6 million related to the sale of the Company’s manufacturing
operations and $20.7 million in capital and tax distributions from Discovery Family Channel. The 2014
utilization is almost wholly offset by $64.4 million of cash received from Discovery from the partial sale of the
Company’s equity interest in the Network and $36.0 million of cash received from the sale of certain intellectual
property licensing rights which was included in other investing activities in the consolidated statements of cash
flows. The higher utilization in 2013 reflects the Company’s acquisition of a majority stake in Backflip for
$110.0 million, net of cash acquired, as well as a payment related to an existing intellectual property.
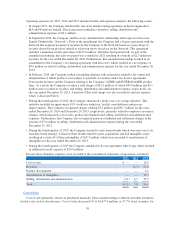
The Company commits to inventory production, advertising and marketing expenditures prior to the peak
fourth quarter retail selling season. Accounts receivable increase during the third and fourth quarter as customers
increase their purchases to meet expected consumer demand in their holiday selling season. Due to the
concentrated timeframe of this selling period, payments for these accounts receivable are generally not due until
the fourth quarter or early in the first quarter of the subsequent year. This timing difference between expenditures
and cash collections on accounts receivable makes it necessary for the Company to borrow higher amounts
during the latter part of the year. During 2015, 2014 and 2013, the Company primarily used cash from operations
and borrowings under its commercial paper program and available lines of credit.
The Company has an agreement with a group of banks which provides for a commercial paper program (the
“Program”). Under the Program, at the request of the Company and subject to market conditions, the banks may
either purchase from the Company, or arrange for the sale by the Company, of unsecured commercial paper
notes. The Company may issue notes from time to time up to an aggregate principal amount outstanding at any
given time of $700.0 million. The maturities of the notes may vary but may not exceed 397 days. The notes are
sold under customary terms in the commercial paper market and are issued at a discount to par, or alternatively,
sold at par and bear varying interest rates based on a fixed or floating rate basis. The interest rates vary based on
market conditions and the ratings assigned to the notes by the credit rating agencies at the time of issuance.
Borrowings under the Program are supported by the Company’s $700.0 million revolving credit agreement. At
December 27, 2015, the Company had $160.0 million in borrowings outstanding related to the Program.
46