Hasbro 2015 Annual Report Download - page 52
Download and view the complete annual report
Please find page 52 of the 2015 Hasbro annual report below. You can navigate through the pages in the report by either clicking on the pages listed below, or by using the keyword search tool below to find specific information within the annual report.-
 1
1 -
2
-
3
-
4
-
5
-
6
-
7
-
8
-
9
-
10
-
11
-
12
-
13
-
14
-
15
-
16
-
17
-
18
-
19
-
20
-
21
-
22
-
23
-
24
-
25
-
26
-
27
-
28
-
29
-
30
-
31
-
32
-
33
-
34
-
35
-
36
-
37
-
38
-
39
-
40
-
41
-
 42
42 -
 43
43 -
 44
44 -
 45
45 -
 46
46 -
 47
47 -
 48
48 -
 49
49 -
 50
50 -
 51
51 -
 52
52 -
 53
53 -
 54
54 -
 55
55 -
 56
56 -
 57
57 -
 58
58 -
 59
59 -
 60
60 -
 61
61 -
 62
62 -
63
-
64
-
65
-
66
-
67
-
68
-
69
-
70
-
71
-
72
-
73
-
74
-
75
-
76
-
77
-
78
-
79
-
80
-
81
-
82
-
83
-
84
-
85
-
86
-
87
-
88
-
89
-
90
-
91
-
92
-
93
-
94
-
95
-
96
-
97
-
98
-
99
-
100
-
101
-
102
-
103
-
104
-
105
-
106
-
107
-
108
-
109
-
110
-
111
-
112
-
113
-
114
-
115
-
116
-
117
-
118
-
119
-
120
-
121
-
122
-
123
-
124
-
125
-
126
 |
 |

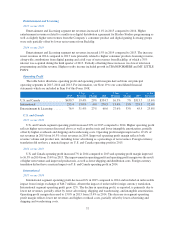
Advertising Expense
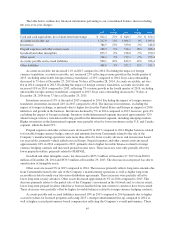
Advertising expense in 2015 totaled $409.4 million compared to $420.3 million in 2014 and $398.1 million
in 2013. The level of the Company’s advertising expense can generally be impacted by revenue mix, the amount
and type of theatrical releases, and television programming. Advertising as a percentage of net revenues
decreased to 9.2% in 2015 from 9.8% in 2014. The year-over-year decrease in advertising expense reflects the
mix of revenues, primarily the higher level of partner brand net revenues, as well as the increase in Entertainment
and Licensing segment net revenues. Entertainment-backed product lines generally require less in advertising by
the Company. Advertising expense was consistent as a percentage of net revenues in 2014 and 2013 at 9.8% of
net revenues. The increase in dollars in advertising expense in 2014 compared to 2013 was primarily due to
higher net revenues.
Amortization of Intangibles
Amortization of intangibles totaled $43.7 million, or 1.0% of net revenues, in 2015 compared to $52.7
million, or 1.2% of net revenues, in 2014 and $78.2 million, or 1.9% of net revenues in 2013. Lower amortization
of intangibles in 2015 compared to 2014 reflects the impact of intangible assets which were fully amortized
during 2014 and 2015. Amortization of intangibles in 2013 includes $19.7 million related to impairment of
definite-lived intangibles based on the Company’s decision to exit the related product lines. Absent the impact of
these charges, amortization of intangibles was $58.5 million, or 1.4% of net revenues, in 2013. Lower
amortization of intangibles in 2014 compared to 2013 reflects the impact of intangible assets which were fully
amortized during 2013.
Program Product Cost Amortization
Program production cost amortization totaled $42.4 million, or 1.0% of net revenues, compared to $47.1
million, or 1.1% of net revenues, in 2014 and $47.7 million, or 1.2% of net revenues, in 2013. Program
production costs are capitalized as incurred and amortized using the individual-film-forecast method. Program
production cost amortization reflects the level of revenues associated with television programming as well as the
type of television programs produced and distributed. The decrease in program production cost amortization in
2015 compared to 2014 was primarily due to a lower amount of accelerated amortization.
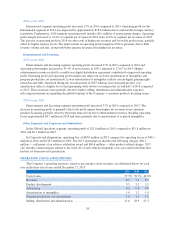
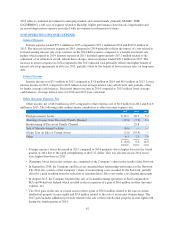
Selling, Distribution and Administration Expenses
Selling, distribution and administration expenses were $960.8 million, or 21.6% of net revenues, in 2015
compared to $895.5 million, or 20.9% of net revenues, in 2014. Selling, distribution and administration expense
for 2015 includes a benefit of $3.1 million related to the August 2015 sale of the Company’s manufacturing
operations while 2014 includes a charge of $6.1 million related to restructuring activities, including the
Company’s equity investment in the joint venture television network. Absent these charges, selling, distribution
and administration expenses increased to $963.9 million, or 21.7% of net revenues, in 2015 from $889.4 million,
or 20.8% of net revenues in 2014. Foreign exchange resulted in a decrease of $66.7 million in 2015 compared to
2014. Excluding the impact of foreign exchange and the impact of the benefits and charges discussed above,
selling, distribution and administration costs increased primarily due to higher administration, marketing and
sales and distribution costs. Higher 2015 administration and sales and marketing expenses are primarily the result
of higher performance-based stock compensation, investments in the MAGIC: THE GATHERING brand,
depreciation expense and other general cost increases, such as salaries and wages. Higher distribution costs
reflect increased net revenues in 2015, excluding the impact of foreign exchange.
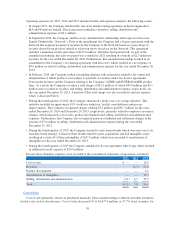
Selling, distribution and administration expenses increased to $895.5 million, or 20.9% of net revenues, in
2014 from $871.7 million, or 21.3% of net revenues, in 2013. Selling, distribution and administration expense in
2013 includes $32.5 million of charges related to restructuring activities, and legal costs associated with the
arbitration settlement. Excluding these charges as well as the 2014 charges discussed above, selling, distribution
and administration expense increased to $889.4 million, or 20.8% of net revenues, in 2014 from $839.2 million,
or 20.6% of net revenues, in 2013. Higher selling, distribution and administration expenses in 2014 compared to
41