Hasbro 2015 Annual Report Download - page 49
Download and view the complete annual report
Please find page 49 of the 2015 Hasbro annual report below. You can navigate through the pages in the report by either clicking on the pages listed below, or by using the keyword search tool below to find specific information within the annual report.-
 1
1 -
2
-
3
-
4
-
5
-
6
-
7
-
8
-
9
-
10
-
11
-
12
-
13
-
14
-
15
-
16
-
17
-
18
-
19
-
20
-
21
-
22
-
23
-
24
-
25
-
26
-
27
-
28
-
29
-
30
-
31
-
32
-
33
-
34
-
35
-
36
-
37
-
38
-
 39
39 -
 40
40 -
 41
41 -
 42
42 -
 43
43 -
 44
44 -
 45
45 -
 46
46 -
 47
47 -
 48
48 -
 49
49 -
 50
50 -
 51
51 -
 52
52 -
 53
53 -
 54
54 -
 55
55 -
 56
56 -
 57
57 -
 58
58 -
 59
59 -
60
-
61
-
62
-
63
-
64
-
65
-
66
-
67
-
68
-
69
-
70
-
71
-
72
-
73
-
74
-
75
-
76
-
77
-
78
-
79
-
80
-
81
-
82
-
83
-
84
-
85
-
86
-
87
-
88
-
89
-
90
-
91
-
92
-
93
-
94
-
95
-
96
-
97
-
98
-
99
-
100
-
101
-
102
-
103
-
104
-
105
-
106
-
107
-
108
-
109
-
110
-
111
-
112
-
113
-
114
-
115
-
116
-
117
-
118
-
119
-
120
-
121
-
122
-
123
-
124
-
125
-
126
 |
 |
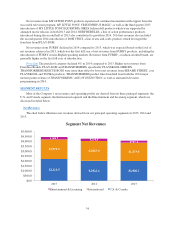
2014 versus 2013
International segment operating profit increased 15% in 2014 compared to 2013. Operating profit for the
International segment in 2014 was impacted by approximately $18.8 million due to unfavorable foreign currency
translation. Furthermore, 2014 segment operating profit includes $6.1 million of restructuring charges. Operating
profit margin increased to 13.4% of segment net revenues in 2014 from 12.6% of segment net revenues in 2013.
The increase in operating profit in 2014 was the result of higher net revenues and favorable product mix, partially
offset by higher expense levels. The improvement in operating profit margin in 2014 is primarily due to both
revenue volume and mix, along with better expense leverage from higher net revenues.
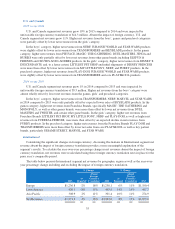
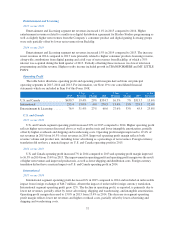
Entertainment and Licensing
2015 versus 2014
Entertainment and Licensing segment operating profit increased 27% in 2015 compared to 2014 and
operating profit margin increased to 31.4% of net revenues in 2015 compared to 27.6% in 2014. Higher
entertainment revenues related to a multi-year digital distribution agreement contributed to improved operating
profit. Operating profit and operating profit margin also improved on lower amortization of intangibles and
program production cost amortization. Lower amortization of intangibles reflects certain digital gaming rights
which became fully amortized during the second quarter of 2015 whereas lower program product cost
amortization reflects a higher level of programming write downs occurring in the second half of 2014 compared
to 2015. These increases were partially offset by higher selling, distribution and administration expenses
reflecting investment in expanding the global footprint of the Company’s consumer products licensing teams.
2014 versus 2013
Entertainment and Licensing segment operating profit increased 33% in 2014 compared to 2013. The
increase in operating profit is primarily due to the profit impact from higher net revenues from consumer
products licensing, partially offset by the profit impact from lower entertainment revenues. Backflip operating
losses approximated $8.7 million in 2014 and were primarily due to amortization of acquired intangibles.
Other Segments and Corporate and eliminations
In the Global Operations segment, operating profit of $12.0 million in 2015 compared to $15.8 million in
2014 and $6.7 million in 2013.
In Corporate and eliminations, operating loss of $83.0 million in 2015 compared to operating losses of $46.1
million in 2014 and $134.3 million in 2013. The 2013 operating loss includes the following charges, $46.1
million — settlement of an adverse arbitration award and $40.6 million — other product-related charges. 2013
also includes certain charges related to the write-off of early film development costs associated with films that
had not yet been moved to production.
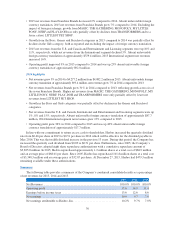
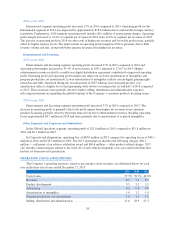
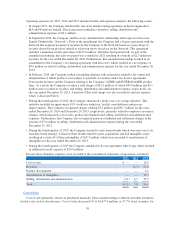
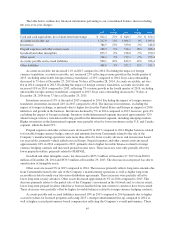
OPERATING COSTS AND EXPENSES
The Company’s operating expenses, stated as percentages of net revenues, are illustrated below for each
year in the three fiscal years ended December 27, 2015:
2015 2014 2013
Cost of sales ..................................................... 37.7% 39.7% 41.0%
Royalties ........................................................ 8.5 7.1 8.3
Product development .............................................. 5.5 5.2 5.1
Advertising ...................................................... 9.2 9.8 9.8
Amortization of intangibles ......................................... 1.0 1.2 1.9
Program production cost amortization ................................. 1.0 1.1 1.2
Selling, distribution and administration ................................ 21.6 20.9 21.3
38