Hasbro 2015 Annual Report Download - page 41
Download and view the complete annual report
Please find page 41 of the 2015 Hasbro annual report below. You can navigate through the pages in the report by either clicking on the pages listed below, or by using the keyword search tool below to find specific information within the annual report.-
 1
1 -
2
-
3
-
4
-
5
-
6
-
7
-
8
-
9
-
10
-
11
-
12
-
13
-
14
-
15
-
16
-
17
-
18
-
19
-
20
-
21
-
22
-
23
-
24
-
25
-
26
-
27
-
28
-
29
-
30
-
 31
31 -
 32
32 -
 33
33 -
 34
34 -
 35
35 -
 36
36 -
 37
37 -
 38
38 -
 39
39 -
 40
40 -
 41
41 -
 42
42 -
 43
43 -
 44
44 -
 45
45 -
 46
46 -
 47
47 -
 48
48 -
 49
49 -
 50
50 -
 51
51 -
52
-
53
-
54
-
55
-
56
-
57
-
58
-
59
-
60
-
61
-
62
-
63
-
64
-
65
-
66
-
67
-
68
-
69
-
70
-
71
-
72
-
73
-
74
-
75
-
76
-
77
-
78
-
79
-
80
-
81
-
82
-
83
-
84
-
85
-
86
-
87
-
88
-
89
-
90
-
91
-
92
-
93
-
94
-
95
-
96
-
97
-
98
-
99
-
100
-
101
-
102
-
103
-
104
-
105
-
106
-
107
-
108
-
109
-
110
-
111
-
112
-
113
-
114
-
115
-
116
-
117
-
118
-
119
-
120
-
121
-
122
-
123
-
124
-
125
-
126
 |
 |
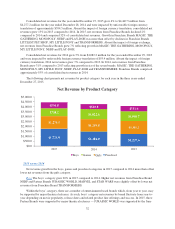
• 2015 net revenues from Franchise Brands decreased 2% compared to 2014. Absent unfavorable foreign
currency translation, 2015 net revenues from Franchise Brands grew 7% compared to 2014. Excluding the
impact of foreign exchange, growth from MAGIC: THE GATHERING, MONOPOLY, MY LITTLE
PONY, NERF and PLAY-DOH was only partially offset by declines from TRANSFORMERS and to a
lesser extent, LITTLEST PET SHOP.
• Growth from the Boys, Games and Preschool categories in 2015 compared to 2014 was partially offset by
declines in the Girls category, both as reported and excluding the impact of foreign currency translation.
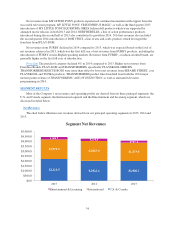
• 2015 net revenues from the U.S. and Canada and Entertainment and Licensing segments were up 10% and
11%, respectively, while net revenues from the International segment declined 3%. Absent unfavorable
foreign currency translation of approximately $379.4 million, 2015 International segment net revenues
increased 16%.
• Operating profit improved 9% in 2015 compared to 2014 and was up 23% absent unfavorable foreign
currency translation of approximately $92.0 million.
2014 highlights
• Net revenues grew 5% in 2014 to $4,277.2 million from $4,082.2 million in 2013. Absent unfavorable foreign
currency translation of approximately $93.4 million, net revenues grew 7% in 2014 compared to 2013.
• Net revenues from Franchise Brands grew 31% in 2014 compared to 2013, reflecting growth across six of
the seven Franchise Brands. Higher net revenues from MAGIC: THE GATHERING, MONOPOLY, MY
LITTLE PONY, NERF, PLAY-DOH and TRANSFORMERS were only partially offset by lower net
revenues from LITTLEST PET SHOP.
• Growth in the Boys and Girls categories was partially offset by declines in the Games and Preschool
categories.
• Net revenues from the U.S. and Canada, International and Entertainment and Licensing segments were up
1%, 8% and 15%, respectively. Absent unfavorable foreign currency translation of approximately $87.7
million, 2014 International segment net revenues grew 13% compared to 2013.
• Operating profit grew 36% in 2014 compared to 2013 and was up 40% absent unfavorable foreign
currency translation of approximately $17.7 million.
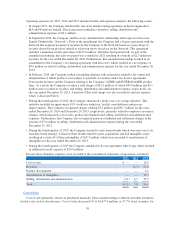
In line with our commitment to return excess cash to shareholders, Hasbro increased the quarterly dividend
rate from $0.46 per share in 2015 to $0.51 per share in 2016 which will be effective for the dividend payable in
May 2016. This was the twelfth dividend increase in the previous 13 years. During that period, the Company has
increased the quarterly cash dividend from $0.03 to $0.51 per share. Furthermore, since 2005, the Company’s
Board of Directors adopted eight share repurchase authorizations with a cumulative repurchase amount of
$3,825.0 million. In 2015, Hasbro repurchased approximately 1.2 million shares at a total cost of $84.9 million
and an average price of $68.01 per share. Since 2005, Hasbro has repurchased 101.8 million shares at a total cost
of $3,348.3 million and an average price of $32.87 per share. At December 27, 2015, Hasbro had $479.3 million
remaining available under these authorizations.
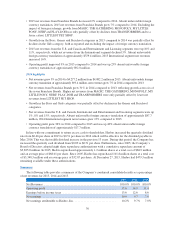
Summary
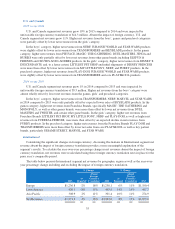
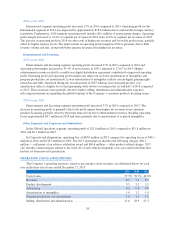
The following table provides a summary of the Company’s condensed consolidated results as a percentage
of net revenues for 2015, 2014 and 2013.
2015 2014 2013
Net Revenues ................................................. 100.0% 100.0% 100.0%
Operating profit ............................................... 15.6 14.9 11.4
Earnings before income taxes .................................... 13.6 12.6 8.6
Net earnings .................................................. 10.0 9.7 7.0
Net earnings attributable to Hasbro, Inc. ............................ 10.2% 9.7% 7.0%
30