Hasbro 2014 Annual Report Download - page 80
Download and view the complete annual report
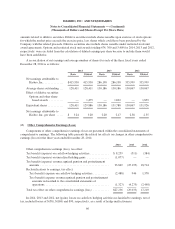
Please find page 80 of the 2014 Hasbro annual report below. You can navigate through the pages in the report by either clicking on the pages listed below, or by using the keyword search tool below to find specific information within the annual report.-
 1
1 -
2
-
3
-
4
-
5
-
6
-
7
-
8
-
9
-
10
-
11
-
12
-
13
-
14
-
15
-
16
-
17
-
18
-
19
-
20
-
21
-
22
-
23
-
24
-
25
-
26
-
27
-
28
-
29
-
30
-
31
-
32
-
33
-
34
-
35
-
36
-
37
-
38
-
39
-
40
-
41
-
42
-
43
-
44
-
45
-
46
-
47
-
48
-
49
-
50
-
51
-
52
-
53
-
54
-
55
-
56
-
57
-
58
-
59
-
60
-
61
-
62
-
63
-
64
-
65
-
66
-
67
-
68
-
69
-
 70
70 -
 71
71 -
 72
72 -
 73
73 -
 74
74 -
 75
75 -
 76
76 -
 77
77 -
 78
78 -
 79
79 -
 80
80 -
 81
81 -
 82
82 -
 83
83 -
 84
84 -
 85
85 -
 86
86 -
 87
87 -
 88
88 -
 89
89 -
 90
90 -
91
-
92
-
93
-
94
-
95
-
96
-
97
-
98
-
99
-
100
-
101
-
102
-
103
-
104
-
105
-
106
-
107
-
108
-
109
-
110
-
111
-
112
-
113
-
114
-
115
-
116
-
117
-
118
-
119
-
120
-
121
-
122
-
123
-
124
-
125
-
126
-
127
 |
 |

HASBRO, INC. AND SUBSIDIARIES
Notes to Consolidated Financial Statements — (Continued)
(Thousands of Dollars and Shares Except Per Share Data)
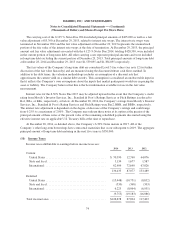
amounts related to dilutive securities. Dilutive securities include shares issuable upon exercise of stock options
for which the market price exceeds the exercise price, less shares which could have been purchased by the
Company with the related proceeds. Dilutive securities also include shares issuable under restricted stock unit
award agreements. Options and restricted stock unit awards totaling 674, 760 and 3,409 for 2014, 2013 and 2012,
respectively, were excluded from the calculation of diluted earnings per share because to include them would
have been antidilutive.
A reconciliation of net earnings and average number of shares for each of the three fiscal years ended
December 28, 2014 is as follows:
2014 2013 2012
Basic Diluted Basic Diluted Basic Diluted
Net earnings attributable to
Hasbro, Inc. ............. $415,930 415,930 286,198 286,198 335,999 335,999
Average shares outstanding . . . 128,411 128,411 130,186 130,186 130,067 130,067
Effect of dilutive securities:
Options and other share-
based awards .......... — 1,475 — 1,602 — 1,859
Equivalent shares ........... 128,411 129,886 130,186 131,788 130,067 131,926
Net earnings attributable to
Hasbro, Inc. per share ..... $ 3.24 3.20 2.20 2.17 2.58 2.55
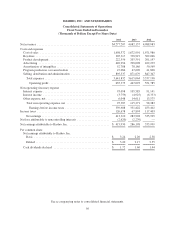
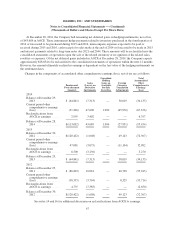
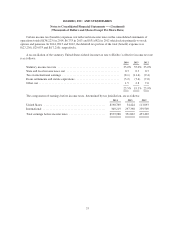
(2) Other Comprehensive Earnings (Loss)
Components of other comprehensive earnings (loss) are presented within the consolidated statements of
comprehensive earnings. The following table presents the related tax effects on changes in other comprehensive
earnings (loss) for the three years ended December 28, 2014.
2014 2013 2012
Other comprehensive earnings (loss), tax effect:
Tax benefit (expense) on cash flow hedging activities ............. $ 8,259 (511) (384)
Tax benefit (expense) on unrealized holding gains ............... (1,077) — —
Tax benefit (expense) on unrecognized pension and postretirement
amounts ............................................... 23,869 (25,193) 18,714
Reclassifications to earnings, tax effect:
Tax (benefit) expense on cash flow hedging activities ........... (2,488) 946 1,378
Tax (benefit) expense on unrecognized pension and postretirement
amounts reclassified to the consolidated statements of
operations ........................................... (1,327) (4,275) (2,498)
Total tax effect on other comprehensive earnings (loss) ........... $27,236 (29,033) 17,210
In 2014, 2013 and 2012, net (gains) losses on cash flow hedging activities reclassified to earnings, net of
tax, included losses of $(58), $(168) and $90, respectively, as a result of hedge ineffectiveness.
66