Hasbro 2014 Annual Report Download - page 8
Download and view the complete annual report
Please find page 8 of the 2014 Hasbro annual report below. You can navigate through the pages in the report by either clicking on the pages listed below, or by using the keyword search tool below to find specific information within the annual report.-
 1
1 -
 2
2 -
 3
3 -
 4
4 -
 5
5 -
 6
6 -
 7
7 -
 8
8 -
 9
9 -
 10
10 -
 11
11 -
 12
12 -
 13
13 -
 14
14 -
 15
15 -
 16
16 -
 17
17 -
 18
18 -
 19
19 -
20
-
21
-
22
-
23
-
24
-
25
-
26
-
27
-
28
-
29
-
30
-
31
-
32
-
33
-
34
-
35
-
36
-
37
-
38
-
39
-
40
-
41
-
42
-
43
-
44
-
45
-
46
-
47
-
48
-
49
-
50
-
51
-
52
-
53
-
54
-
55
-
56
-
57
-
58
-
59
-
60
-
61
-
62
-
63
-
64
-
65
-
66
-
67
-
68
-
69
-
70
-
71
-
72
-
73
-
74
-
75
-
76
-
77
-
78
-
79
-
80
-
81
-
82
-
83
-
84
-
85
-
86
-
87
-
88
-
89
-
90
-
91
-
92
-
93
-
94
-
95
-
96
-
97
-
98
-
99
-
100
-
101
-
102
-
103
-
104
-
105
-
106
-
107
-
108
-
109
-
110
-
111
-
112
-
113
-
114
-
115
-
116
-
117
-
118
-
119
-
120
-
121
-
122
-
123
-
124
-
125
-
126
-
127
 |
 |

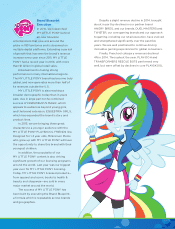
In 2014, our consumer licensing eorts delivered
our highest revenues ever within the Entertainment
and Licensing segment. Revenues in the segment
grew 15% year-over-year to $219 million. This segment
also carries the highest operating margins across
the Company, and, in 2014, operating profit for
Entertainment and Licensing increased 33% to $60.6
million. MY LITTLE PONY and TRANSFORMERS
licensing were key contributors to this growth.
Engaging Consumers Around the Globe
Much of our consumer engagement is happening
outside the developed economies. The global
execution of our strategy drove International segment
revenue growth of 8% in 2014, or 13% on a constant
currency basis. Six of seven Hasbro Franchise Brands
grew in the International segment.
Our playbook to continue growing in these
significant markets includes driving consumer
engagement with innovative product lines for
Hasbro and partner brands, combined with
television and film content distributed across
mediums. These elements make our brands
more attractive to a growing middle class
increasingly shopping for brands. Emerging
markets now represent 16% of our total revenues
— a significant increase from a few years ago.
2014 emerging markets revenues increased 20%
year-over-year while operating profit grew 23%.
Despite profitability gains, our emerging markets
operating profit of approximately 10% continues
to reflect the investments we are making and the
scale to which we are building in these countries.
International growth, however, was not limited
to emerging markets. We grew across all major
geographic regions, including major markets such as
the UK, Italy and Spain, as well as Mexico, which is a
developing market for Hasbro.
In the U.S. and Canada segment, actions we have
taken over the past several years to reduce inventory,
strengthen our channel strategy and enhance our
digital and online capabilities have helped return the
segment to growth in 2014. This strong execution,
coupled with product innovation and content,
resulted in all seven of Hasbro’s Franchise Brands
increasing revenues in the U.S. and Canada segment
in 2014.
2014 Was Not Without Challenges
If we turned the clock back to this time last
year, the outlook for Hasbro was strong—and we
delivered on that promise. Yet, as is often true in
our industry, delivering on that opportunity was not
without its challenges.
Total 2014 revenue growth of 5% was broadly
based across Franchise and Partner Brands and
geographies, but had to compensate for significant
declines in both FURBY and BEYBLADE.
As previously mentioned, international revenues
grew 8%, but were significantly impacted by the
strengthening U.S. dollar. The impact was most
pronounced in November and December and
in total, foreign exchange translation reduced
reported 2014 revenues by $93 million. Excluding
this impact, revenue growth in the International
segment would have been greater, at 13%.
Foreign exchange will continue to be a headwind
in 2015 to both revenues and profits. In 2014, the shift
in currency happened in a very short period of time.
It also impacted nearly all currencies we do business
in negatively against the U.S. dollar. As a result, we
were not able to react and adjust our business model
immediately. As we look ahead, we will work to
manage the foreign exchange impact on our business
as we do all other exogenous factors.
Despite these headwinds, the momentum in our
brands in 2014, combined with innovative products,
engaging marketing campaigns and compelling
entertainment, positions us well for 2015.
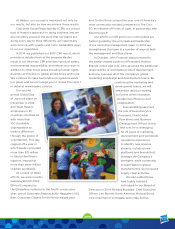
Leadership for the Future
As our business expands, it is imperative that
we have the best talent and strongest leadership
guiding the evolution of our organization. Our mission
is to Create the World’s Best Play Experiences. The
best play experiences stand apart, delivering joy,
creativity and connection around the world and
across generations.
ANNUAL REPORT