Hasbro 2014 Annual Report Download - page 102
Download and view the complete annual report
Please find page 102 of the 2014 Hasbro annual report below. You can navigate through the pages in the report by either clicking on the pages listed below, or by using the keyword search tool below to find specific information within the annual report.-
 1
1 -
2
-
3
-
4
-
5
-
6
-
7
-
8
-
9
-
10
-
11
-
12
-
13
-
14
-
15
-
16
-
17
-
18
-
19
-
20
-
21
-
22
-
23
-
24
-
25
-
26
-
27
-
28
-
29
-
30
-
31
-
32
-
33
-
34
-
35
-
36
-
37
-
38
-
39
-
40
-
41
-
42
-
43
-
44
-
45
-
46
-
47
-
48
-
49
-
50
-
51
-
52
-
53
-
54
-
55
-
56
-
57
-
58
-
59
-
60
-
61
-
62
-
63
-
64
-
65
-
66
-
67
-
68
-
69
-
70
-
71
-
72
-
73
-
74
-
75
-
76
-
77
-
78
-
79
-
80
-
81
-
82
-
83
-
84
-
85
-
86
-
87
-
88
-
89
-
90
-
91
-
 92
92 -
 93
93 -
 94
94 -
 95
95 -
 96
96 -
 97
97 -
 98
98 -
 99
99 -
 100
100 -
 101
101 -
 102
102 -
 103
103 -
 104
104 -
 105
105 -
 106
106 -
 107
107 -
 108
108 -
 109
109 -
 110
110 -
 111
111 -
 112
112 -
113
-
114
-
115
-
116
-
117
-
118
-
119
-
120
-
121
-
122
-
123
-
124
-
125
-
126
-
127
 |
 |

HASBRO, INC. AND SUBSIDIARIES
Notes to Consolidated Financial Statements — (Continued)
(Thousands of Dollars and Shares Except Per Share Data)
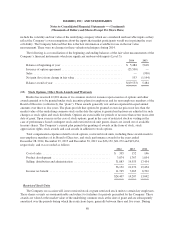
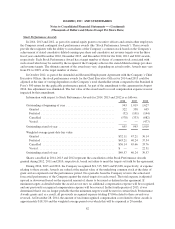
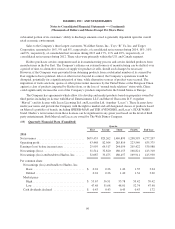
For 2014, 2013 and 2012, the Company measured the assets and obligations of the Plans as of the fiscal
year-end. The following is a detail of the components of the net periodic benefit cost for the three years ended
December 28, 2014.
2014 2013 2012
Components of Net Periodic Cost
Pension
Service cost ............................................ $ 1,824 2,579 1,784
Interest cost ............................................ 16,209 15,597 16,669
Expected return on assets .................................. (18,631) (17,761) (18,097)
Amortization of prior service cost ........................... 98 98 157
Amortization of actuarial loss .............................. 3,351 7,070 6,221
Curtailment/settlement losses ............................... — 6,993 672
Net periodic benefit cost .................................. $ 2,851 14,576 7,406
Postretirement
Service cost ............................................ $ 543 750 735
Interest cost ............................................ 1,337 1,380 1,758
Amortization of actuarial (gain) loss ......................... (457) (264) 80
Net periodic benefit cost .................................. $ 1,423 1,866 2,573
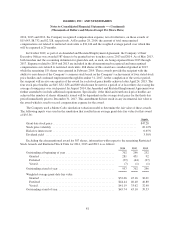
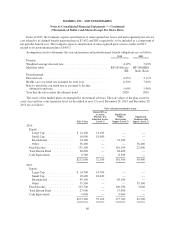
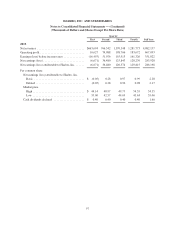
Assumptions used to determine net periodic benefit cost of the pension plan and postretirement plan for
each fiscal year follow:
2014 2013 2012
Pension
Weighted average discount rate .................................... 5.02% 4.49% 4.96%
Long-term rate of return on plan assets ............................... 7.00% 7.00% 7.00%
Postretirement
Discount rate ................................................... 5.11% 4.34% 5.17%
Health care cost trend rate assumed for next year ....................... 7.00% 7.00% 7.00%
Rate to which the cost trend rate is assumed to decline (ultimate trend
rate) ........................................................ 5.00% 5.00% 5.00%
Year that the rate reaches the ultimate trend rate ....................... 2020 2020 2020
If the health care cost trend rate were increased one percentage point in each year, the accumulated
postretirement benefit obligation at December 28, 2014 and the aggregate of the benefits earned during the
period and the interest cost would have both increased by approximately 1%.
Hasbro works with external benefit investment specialists to assist in the development of the long-term rate
of return assumptions used to model and determine the overall asset allocation. Forecast returns are based on the
combination of historical returns, current market conditions and a forecast for the capital markets for the next 5-7
years. All asset class assumptions are within certain bands around the long-term historical averages. Correlations
are based primarily on historical return patterns.
88