Hasbro 2014 Annual Report Download - page 51
Download and view the complete annual report
Please find page 51 of the 2014 Hasbro annual report below. You can navigate through the pages in the report by either clicking on the pages listed below, or by using the keyword search tool below to find specific information within the annual report.-
 1
1 -
2
-
3
-
4
-
5
-
6
-
7
-
8
-
9
-
10
-
11
-
12
-
13
-
14
-
15
-
16
-
17
-
18
-
19
-
20
-
21
-
22
-
23
-
24
-
25
-
26
-
27
-
28
-
29
-
30
-
31
-
32
-
33
-
34
-
35
-
36
-
37
-
38
-
39
-
40
-
 41
41 -
 42
42 -
 43
43 -
 44
44 -
 45
45 -
 46
46 -
 47
47 -
 48
48 -
 49
49 -
 50
50 -
 51
51 -
 52
52 -
 53
53 -
 54
54 -
 55
55 -
 56
56 -
 57
57 -
 58
58 -
 59
59 -
 60
60 -
 61
61 -
62
-
63
-
64
-
65
-
66
-
67
-
68
-
69
-
70
-
71
-
72
-
73
-
74
-
75
-
76
-
77
-
78
-
79
-
80
-
81
-
82
-
83
-
84
-
85
-
86
-
87
-
88
-
89
-
90
-
91
-
92
-
93
-
94
-
95
-
96
-
97
-
98
-
99
-
100
-
101
-
102
-
103
-
104
-
105
-
106
-
107
-
108
-
109
-
110
-
111
-
112
-
113
-
114
-
115
-
116
-
117
-
118
-
119
-
120
-
121
-
122
-
123
-
124
-
125
-
126
-
127
 |
 |

margin in 2014 compared to 2013 was the result of both higher net revenues and improved product mix, as well
as lower shipping and distribution costs. In 2013, operating profit decreased in dollars compared to 2012 as a
result of lower net revenues and, to a lesser extent, higher product development and selling, distribution and
administration expenses partially offset by lower advertising expense. 2013 operating profit margin increased as
a result of more favorable product mix and lower advertising expense as a percentage of net revenues partially
offset by higher product development and selling, distribution and administration expenses as a percentage of net
revenues. Foreign currency translation did not have a material impact on U.S. and Canada operating profit in
2014 or 2013.
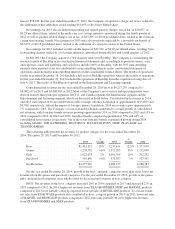
International
International segment net revenues for the year ended December 28, 2014 increased 8% compared to 2013
and 5% in 2013 compared to 2012. In 2014 and 2013, net revenues were impacted by (unfavorable)/ favorable
currency translation of approximately $(87,700) and $7,000, respectively, as a result of fluctuations in the U.S.
dollar. Excluding the impact of foreign exchange, net revenues for 2014 and 2013 increased 13% and 5%,
respectively, compared to prior years.
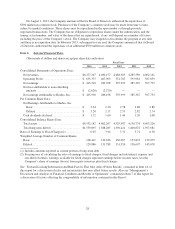
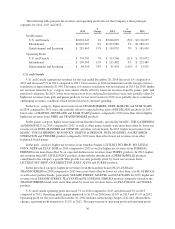
The following table presents net revenues by geographic region for the Company’s International segment
for 2014, 2013 and 2012.
2014
%
Change 2013
%
Change 2012
Europe .......................... $1,258,078 6% 1,190,350 3% 1,154,310
Latin America ..................... 463,512 14% 407,710 12% 362,689
Asia Pacific ...................... 301,407 10% 274,920 4% 265,120
Net revenues ...................... $2,022,997 1,872,980 1,782,119
In 2014, net revenues for Europe, Latin America and Asia Pacific were impacted by unfavorable currency
translation of approximately $61,200, $21,500 and $5,000, respectively. Absent the impact of foreign currency
translation, 2014 net revenues grew 11% in each of Europe and Asia Pacific and 19% in Latin America. Net
revenues in emerging markets, including, but not limited to, Russia, Brazil and China, increased 20% in 2014
compared to 2013. In addition, net revenues grew in certain developed markets, including the United Kingdom,
Italy and Spain, partially offset by lower net revenues in France. In 2013, favorable currency translation of
approximately $27,400 in Europe was partially offset by unfavorable currency translation of approximately
$14,400 and $6,000 in the Latin America and Asia Pacific regions, respectively. Absent the impact of foreign
exchange, 2013 net revenues grew 1%, 16% and 6% in Europe, Latin America and Asia Pacific, respectively,
compared to 2012. In 2013, growth was primarily driven by growth in emerging markets, including Russia,
Brazil and China. Net revenues in emerging markets increased 25% in 2013 and were partially offset by lower
net revenues in certain developed markets including Australia, France and the United Kingdom.
By product category, higher net revenues in 2014 from the boys’, girls’, and preschool categories were
partially offset by lower net revenues from the games category. In 2013, growth in the games, girls’ and
preschool categories were partially offset by lower net revenues in the boys’ category.
In the boys’ category, higher net revenues from TRANSFORMERS, MARVEL and NERF products in 2014
compared to 2013 were only partially offset by expected lower sales of BEYBLADE products. In 2013, lower
sales of BEYBLADE, MARVEL, STAR WARS and KRE-O products compared to 2012 were partially offset by
higher net revenues from TRANSFROMERS and NERF products.
In the games category, growth in franchise brands, specifically MAGIC: THE GATHERING and
MONOPOLY, in 2014 compared to 2013 were more than offset by lower net revenues from ANGRY BIRDS,
TWISTER and certain other game brands. In 2013, higher net revenues from MAGIC: THE GATHERING,
JENGA, TWISTER, ELEFUN & FRIENDS and action battling products compared to 2012 were partially offset
by lower net revenues from other game brands.
37