Hasbro 2014 Annual Report Download - page 100
Download and view the complete annual report
Please find page 100 of the 2014 Hasbro annual report below. You can navigate through the pages in the report by either clicking on the pages listed below, or by using the keyword search tool below to find specific information within the annual report.-
 1
1 -
2
-
3
-
4
-
5
-
6
-
7
-
8
-
9
-
10
-
11
-
12
-
13
-
14
-
15
-
16
-
17
-
18
-
19
-
20
-
21
-
22
-
23
-
24
-
25
-
26
-
27
-
28
-
29
-
30
-
31
-
32
-
33
-
34
-
35
-
36
-
37
-
38
-
39
-
40
-
41
-
42
-
43
-
44
-
45
-
46
-
47
-
48
-
49
-
50
-
51
-
52
-
53
-
54
-
55
-
56
-
57
-
58
-
59
-
60
-
61
-
62
-
63
-
64
-
65
-
66
-
67
-
68
-
69
-
70
-
71
-
72
-
73
-
74
-
75
-
76
-
77
-
78
-
79
-
80
-
81
-
82
-
83
-
84
-
85
-
86
-
87
-
88
-
89
-
 90
90 -
 91
91 -
 92
92 -
 93
93 -
 94
94 -
 95
95 -
 96
96 -
 97
97 -
 98
98 -
 99
99 -
 100
100 -
 101
101 -
 102
102 -
 103
103 -
 104
104 -
 105
105 -
 106
106 -
 107
107 -
 108
108 -
 109
109 -
 110
110 -
111
-
112
-
113
-
114
-
115
-
116
-
117
-
118
-
119
-
120
-
121
-
122
-
123
-
124
-
125
-
126
-
127
 |
 |

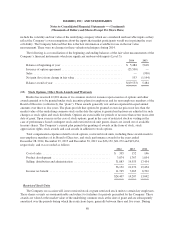
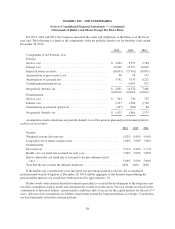
HASBRO, INC. AND SUBSIDIARIES
Notes to Consolidated Financial Statements — (Continued)
(Thousands of Dollars and Shares Except Per Share Data)
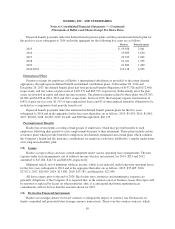
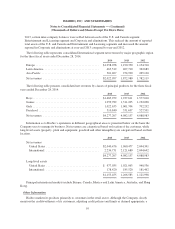
In fiscal 2015, the Company expects amortization of unrecognized net losses and unrecognized prior service
cost related to its defined benefit pension plans of $7,452 and $98, respectively, to be included as a component of
net periodic benefit cost. The Company expects amortization of unrecognized prior service credits in 2015
related to its postretirement plan of $(457).
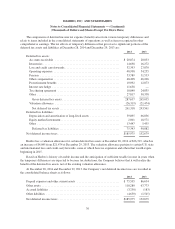
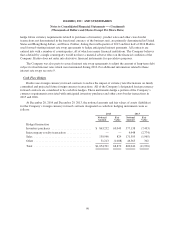
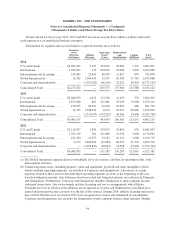
Assumptions used to determine the year-end pension and postretirement benefit obligations are as follows:
2014 2013
Pension
Weighted average discount rate ............................. 4.19% 5.02%
Mortality table .......................................... RP-2014/Scale
BB
RP-2000/IRS
Static Basis
Postretirement
Discount rate ........................................... 4.23% 5.11%
Health care cost trend rate assumed for next year ............... 6.50% 7.00%
Rate to which the cost trend rate is assumed to decline
(ultimate trend rate) .................................... 5.00% 5.00%
Year that the rate reaches the ultimate trend ................... 2020 2020
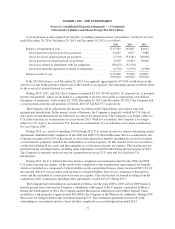
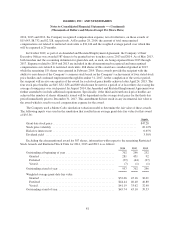
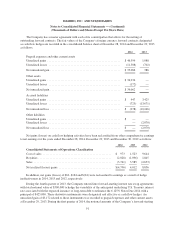
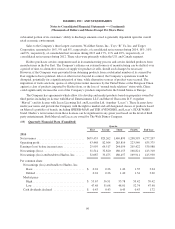
The assets of the funded plans are managed by investment advisors. The fair values of the plan assets by
asset class and fair value hierarchy level (as described in note 12) as of December 28, 2014 and December 29,
2013 are as follows:
Fair Value
Fair value measurements using:
Quoted Prices
in Active
Markets For
Identical Assets
(Level 1)
Significant
Other
Observable
Inputs (Level 2)
Significant
Unobservable
Inputs (Level 3)
2014:
Equity:
Large Cap .................. $ 14,100 14,100 — —
Small Cap .................. 18,000 18,000 — —
International ................. 34,300 — 34,300 —
Other ...................... 36,400 — — 36,400
Fixed Income .................. 132,100 — 110,100 22,000
Total Return Fund .............. 28,600 — 28,600 —
Cash Equivalents ............... 8,500 — 8,500 —
$272,000 32,100 181,500 58,400
2013:
Equity:
Large Cap .................. $ 14,700 14,700 — —
Small Cap .................. 18,400 18,400 — —
International ................. 40,100 — 40,100 —
Other ...................... 59,500 — — 59,500
Fixed Income .................. 103,700 — 100,700 3,000
Total Return Fund .............. 27,900 — 27,900 —
Cash Equivalents ............... 9,000 — 9,000 —
$273,300 33,100 177,700 62,500
86