Hasbro 2014 Annual Report Download - page 72
Download and view the complete annual report
Please find page 72 of the 2014 Hasbro annual report below. You can navigate through the pages in the report by either clicking on the pages listed below, or by using the keyword search tool below to find specific information within the annual report.-
 1
1 -
2
-
3
-
4
-
5
-
6
-
7
-
8
-
9
-
10
-
11
-
12
-
13
-
14
-
15
-
16
-
17
-
18
-
19
-
20
-
21
-
22
-
23
-
24
-
25
-
26
-
27
-
28
-
29
-
30
-
31
-
32
-
33
-
34
-
35
-
36
-
37
-
38
-
39
-
40
-
41
-
42
-
43
-
44
-
45
-
46
-
47
-
48
-
49
-
50
-
51
-
52
-
53
-
54
-
55
-
56
-
57
-
58
-
59
-
60
-
61
-
 62
62 -
 63
63 -
 64
64 -
 65
65 -
 66
66 -
 67
67 -
 68
68 -
 69
69 -
 70
70 -
 71
71 -
 72
72 -
 73
73 -
 74
74 -
 75
75 -
 76
76 -
 77
77 -
 78
78 -
 79
79 -
 80
80 -
 81
81 -
 82
82 -
83
-
84
-
85
-
86
-
87
-
88
-
89
-
90
-
91
-
92
-
93
-
94
-
95
-
96
-
97
-
98
-
99
-
100
-
101
-
102
-
103
-
104
-
105
-
106
-
107
-
108
-
109
-
110
-
111
-
112
-
113
-
114
-
115
-
116
-
117
-
118
-
119
-
120
-
121
-
122
-
123
-
124
-
125
-
126
-
127
 |
 |

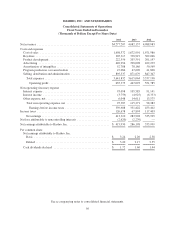
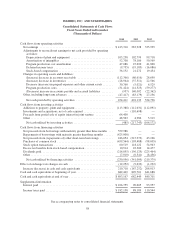
HASBRO, INC. AND SUBSIDIARIES
Consolidated Statements of Cash Flows
Fiscal Years Ended in December
(Thousands of Dollars)
2014 2013 2012
Cash flows from operating activities
Net earnings .................................................. $413,310 283,928 335,999
Adjustments to reconcile net earnings to net cash provided by operating
activities:
Depreciation of plant and equipment ............................. 105,258 102,799 99,718
Amortization of intangibles .................................... 52,708 78,186 50,569
Program production cost amortization ............................ 47,086 47,690 41,800
Deferred income taxes ........................................ (9,755) (19,183) (16,086)
Stock-based compensation ..................................... 36,152 21,272 19,434
Changes in operating assets and liabilities:
(Increase) decrease in accounts receivable ........................ (112,366) (86,616) 28,690
(Increase) decrease in inventories ............................... (28,944) (37,511) 22,546
Decrease (increase) in prepaid expenses and other current assets ....... 30,760 (5,021) 6,529
Program production costs ...................................... (31,424) (41,325) (59,277)
(Decrease) increase in accounts payable and accrued liabilities ........ (957) 140,092 (22,362)
Other, including long-term advances ............................... (47,417) (83,179) 27,236
Net cash provided by operating activities ......................... 454,411 401,132 534,796
Cash flows from investing activities
Additions to property, plant and equipment .......................... (113,388) (112,031) (112,091)
Investments and acquisitions, net of cash acquired .................... — (110,698) —
Proceeds from partial sale of equity interest in joint venture ............ 64,400 — —
Other ........................................................ 48,503 4,986 5,919
Net cash utilized by investing activities ........................... (485) (217,743) (106,172)
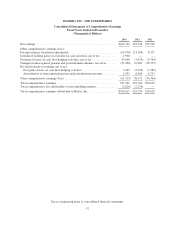
Cash flows from financing activities
Net proceeds from borrowings with maturity greater than three months . . . 559,986 — —
Repayments of borrowings with maturity greater than three months ...... (425,000) — —
Net proceeds from (repayments of) other short-term borrowings ......... 246,054 (215,273) 43,106
Purchases of common stock ...................................... (459,564) (103,488) (98,005)
Stock option transactions ........................................ 60,519 118,122 54,963
Excess tax benefits from stock-based compensation ................... 10,914 22,300 14,477
Dividends paid ................................................ (216,855) (156,129) (225,464)
Other ........................................................ (7,010) (6,541) (8,456)
Net cash utilized by financing activities .......................... (230,956) (341,009) (219,379)
Effect of exchange rate changes on cash .............................. (12,252) (9,632) (1,232)
Increase (decrease) in cash and cash equivalents ...................... 210,718 (167,252) 208,013
Cash and cash equivalents at beginning of year ......................... 682,449 849,701 641,688
Cash and cash equivalents at end of year .............................. $893,167 682,449 849,701
Supplemental information
Interest paid .................................................. $106,755 90,605 93,957
Income taxes paid .............................................. $182,158 88,189 110,544
See accompanying notes to consolidated financial statements.
58