Hasbro 2014 Annual Report Download - page 54
Download and view the complete annual report
Please find page 54 of the 2014 Hasbro annual report below. You can navigate through the pages in the report by either clicking on the pages listed below, or by using the keyword search tool below to find specific information within the annual report.-
 1
1 -
2
-
3
-
4
-
5
-
6
-
7
-
8
-
9
-
10
-
11
-
12
-
13
-
14
-
15
-
16
-
17
-
18
-
19
-
20
-
21
-
22
-
23
-
24
-
25
-
26
-
27
-
28
-
29
-
30
-
31
-
32
-
33
-
34
-
35
-
36
-
37
-
38
-
39
-
40
-
41
-
42
-
43
-
 44
44 -
 45
45 -
 46
46 -
 47
47 -
 48
48 -
 49
49 -
 50
50 -
 51
51 -
 52
52 -
 53
53 -
 54
54 -
 55
55 -
 56
56 -
 57
57 -
 58
58 -
 59
59 -
 60
60 -
 61
61 -
 62
62 -
 63
63 -
 64
64 -
65
-
66
-
67
-
68
-
69
-
70
-
71
-
72
-
73
-
74
-
75
-
76
-
77
-
78
-
79
-
80
-
81
-
82
-
83
-
84
-
85
-
86
-
87
-
88
-
89
-
90
-
91
-
92
-
93
-
94
-
95
-
96
-
97
-
98
-
99
-
100
-
101
-
102
-
103
-
104
-
105
-
106
-
107
-
108
-
109
-
110
-
111
-
112
-
113
-
114
-
115
-
116
-
117
-
118
-
119
-
120
-
121
-
122
-
123
-
124
-
125
-
126
-
127
 |
 |

• During the fourth quarter of 2013, the Company decided to exit certain brands which were non-core to its
franchise brand strategy. Certain of these brands related to prior acquisitions and had intangible assets,
resulting in a write-off of these intangibles of $19,736, which have been recorded to amortization of
intangibles for the year ended December 29, 2013.
• During the fourth quarter of 2013 the Company amended its license agreement with Zynga which resulted
in additional royalty expense of $20,851.
• In the first quarter of 2012 the Company incurred employee severance charges of $11,130 associated with
measures to right size certain businesses and functions. These charges impacted cost of sales, product
development and selling, distribution and administration expense for the year ended December 30, 2012.
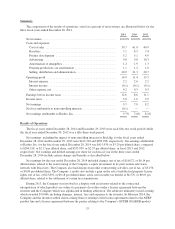
In total, these (benefits) expenses were recorded to the consolidated statements of operations as follows:
2014 2013 2012
Cost of sales ............................................. $ — 10,154 2,764
Royalties ................................................ (2,328) 63,801 —
Product development ...................................... — 4,101 10,949
Amortization of intangibles ................................. — 19,736 —
Selling, distribution and administration ........................ 6,094 32,547 33,463
Total ................................................... $3,766 130,339 47,176
Cost of sales primarily consists of purchased materials, labor, manufacturing overheads and other inventory-
related costs such as obsolescence. Cost of sales increased in dollars to $1,698,372 for the year ended
December 28, 2014 from $1,672,901 and $1,671,980 for 2013 and 2012, respectively, but decreased as a percent
of net revenues to 39.7% in 2014 from 41.0% in 2013 and 40.9% in 2012. Absent the impact of aforementioned
charges, cost of sales was $1,662,747, or 40.7% of net revenues, for the year ended December 29, 2013 and
$1,669,216, or 40.8% of net revenues, for the year ended December 30, 2012. The cost of sales increase in
dollars in 2014 compared to 2013 reflects higher net revenues. The cost of sales decrease as a percent of net
revenues in 2014 compared to 2013 and 2012 reflects a more favorable revenue mix and impact from cost
savings and efficiencies from the Company’s owned-manufacturing facilities partially offset by the impact on net
revenues of higher sales promotions. In 2014, product mix reflects higher net revenues from royalty-bearing
products which generally carry higher pricing and, therefore, have a lower cost of sales as a percentage of net
revenues, as well as higher net revenues from the high margin Entertainment and Licensing segment.
Royalty expense of $305,317, or 7.1% of net revenues, for the year ended December 28, 2014 compared to
$338,919, or 8.3% of net revenues, for the year ended December 29, 2013 and $302,066, or 7.4% of net
revenues, for the year ended December 30, 2012. Excluding the impact of the arbitration award settlement and
amendment of the Zynga agreement summarized above, royalty expense was $275,118, or 6.7% of net revenues,
in 2013. Fluctuations in royalty expense are generally related to the volume of entertainment-driven products
sold in a given year, especially if there is a major motion picture release. Significant revenues from
TRANSFORMERS in 2014 related to the 2014 release of TRANSFORMERS: AGE OF EXTINCTION, and sale
of MARVEL products in 2014 and 2012, particularly those related to the 2014 releases of CAPTAIN AMERICA:
THE WINTER SOLDIER, THE AMAZING-SPIDER MAN 2, and GUARDIANS OF THE GALAXY and the 2012
releases of MARVEL’S THE AVENGERS and THE AMAZING SPIDER-MAN resulted in higher royalty expenses
in those years compared to 2013.
Product development expense in 2014 totaled $222,556, or 5.2% of net revenues, compared to $207,591, or
5.1% of net revenues, in 2013 and $201,197, or 4.9% of net revenues, in 2012. Product development expense for
2013 and 2012 included restructuring charges of $4,101 and $10,949, respectively. Excluding the impact of these
charges, product development expense was $203,490 in 2013 and $190,248 in 2012. The increases in 2014
compared to 2013 and 2013 compared to 2012 primarily reflect the addition of Backflip, as well as continued
investment in certain brands, particularly MAGIC: THE GATHERING. Furthermore, during the fourth quarter of
2014, the Company began to incur development costs related to the DISNEY PRINCESS and FROZEN license
40